. 2012 Apr 17:11:21.
doi: 10.1186/1475-925X-11-21.

Patient-oriented simulation based on Monte Carlo algorithm by using MRI data

Affiliations

Patient-oriented simulation based on Monte Carlo algorithm by using MRI data

Ching-Cheng Chuang et al. Biomed Eng Online. .

Abstract

Background: Although Monte Carlo simulations of light propagation in full segmented three-dimensional MRI based anatomical models of the human head have been reported in many articles. To our knowledge, there is no patient-oriented simulation for individualized calibration with NIRS measurement. Thus, we offer an approach for brain modeling based on image segmentation process with in vivo MRI T1 three-dimensional image to investigate the individualized calibration for NIRS measurement with Monte Carlo simulation.

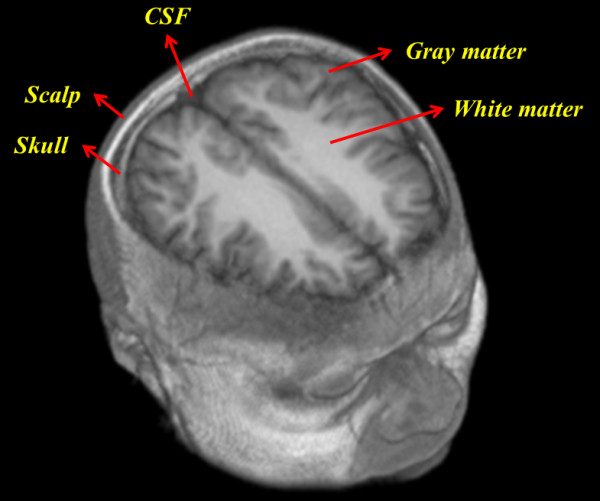
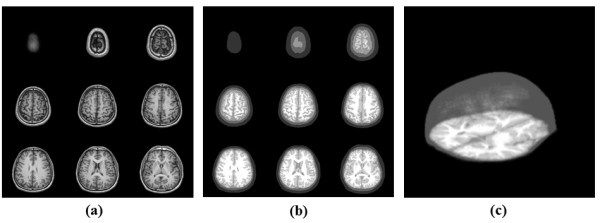
Methods: In this study, an individualized brain is modeled based on in vivo MRI 3D image as five layers structure. The behavior of photon migration was studied for this individualized brain detections based on three-dimensional time-resolved Monte Carlo algorithm. During the Monte Carlo iteration, all photon paths were traced with various source-detector separations for characterization of brain structure to provide helpful information for individualized design of NIRS system.

Results: Our results indicate that the patient-oriented simulation can provide significant characteristics on the optimal choice of source-detector separation within 3.3 cm of individualized design in this case. Significant distortions were observed around the cerebral cortex folding. The spatial sensitivity profile penetrated deeper to the brain in the case of expanded CSF. This finding suggests that the optical method may provide not only functional signal from brain activation but also structural information of brain atrophy with the expanded CSF layer. The proposed modeling method also provides multi-wavelength for NIRS simulation to approach the practical NIRS measurement.

Conclusions: In this study, the three-dimensional time-resolved brain modeling method approaches the realistic human brain that provides useful information for NIRS systematic design and calibration for individualized case with prior MRI data.


Figures

Figure 1
Figure 1
Three dimensional in vivo MRI T1 brain image. In the simulation, the three-dimensional MRI T1 brain image was considered with five layers as scalp, skull, cerebral spinal fluid (CSF), gray matter and white matter. The schematic diagram shows the anatomical structure of the human head.
Figure 2
Figure 2
Segmentation of scalp and skull layer. This figure shows the segmentation process of scalp and skull: (a) two-dimensional anatomical MRI images, (b) contours segmentation with level set operator, (c) boundaries of the scalp and (d) skull layer, and (e), (f) segmentation with region growing approach (scalp = 1, skull = 2), (g) the two layers modeling of the scalp and skull.
Figure 3
Figure 3
Segmentation of CSF, gray matter and white matter. Image process by using unified segmentation. (a) MRI data; (b) segmented CSF, (c) segmented gray matter, and (d) segmented white matter.
Figure 4
Figure 4
The three-dimensional brain model with five layers. Five layers three-dimensional brain structure in Monte Carlo simulation: (a) one slice of brain model with five layers, (b) reconstructed three dimensional brain model, (c) original three dimensional MRI data.
Figure 5
Figure 5
The geometric configuration of source-detector. The source-detector separations on human head model in simulation with transverse view and sagittal view. The separations are 1-10 cm with 1 cm step.
Figure 6
Figure 6
The tomograms with different depths of the brain. This figure shows the result of optical brain modeling from in vivo MRI data. (a) shows nine MRI slices of adult brain, (b) shows the processed optical model with respect to in vivo MRI slices, (c) shows the 3D adult brain structures of reconstructed optical models for Monte Carlo simulation.
Figure 7
Figure 7
The photon migration in the horizontal cross section. The dynamics of photon migration in transverse and sagittal views with 800 nm light illumination: (a) at time = 0 ps, (b) at time = 104 ps, (c) at time = 161 ps, (d) at time = 312 ps, (e) at time = 611 ps, and (f) at time = 1000 ps.
Figure 8
Figure 8
The spatial sensitivity profile with various source-detector separations. This figure shows the photon migration of the received photons with different distances of source-detector separation. (a) Photon trajectories via source-detector separation in transverse view, (b) photon trajectories via source-detector separation in sagittal view, and (c) the received intensity via source-detector separation.
Figure 9
Figure 9
The curve of intensity distribution with multi-wavelength. This figure shows the multi-wavelength (690 nm, 780 nm and 830 nm) distribution of received intensity with various source-detector separations in adult brain models.
Figure 10
Figure 10
The ratios of the backscattered intensities from different layer. This figure shows the distributions of ratio of the received intensity from different layers of brain versus the distance of source-detector separation with multi-wavelength.

References

    1. Strangman G, Boas DA, Sutton JP. Non-invasive neuroimaging using near-infrared light. Biol Psychiatry. 2002;52:679–693. doi: 10.1016/S0006-3223(02)01550-0. - DOI - PubMed
    1. Wolf M, Wolf U, Choi JH, Gupta R, Safonova LP, Paunescu LA, Michalos A, Gratton E. Functional Frequency-Domain Near-Infrared Spectroscopy Detects Fast Neuronal Signal in the Motor Cortex. NeuroImage. 2002;17:1868–1875. doi: 10.1006/nimg.2002.1261. - DOI - PubMed
    1. Gratton G, Brumback CR, Gordon BA, Pearson MA, Low KA, Fabiani M. Effects of measurement method, wavelength, and source-detector distance on the fast optical signal. NeuroImage. 2006;32:1576–1590. doi: 10.1016/j.neuroimage.2006.05.030. - DOI - PubMed
    1. Medvedeva AV, Kainerstorferb J, Borisova SV, Barbourc RL, VanMetera J. Event-related fast optical signal in a rapid object recognition task: Improving detection by the independent component analysis. Brain Res. 2008;1236:145–158. - PMC - PubMed
    1. Hillman EMC. Optical brain imaging in vivo: techniques and applications from animal to man. J Biomed Opt. 2007;12:051402. doi: 10.1117/1.2789693. - DOI - PMC - PubMed

Publication types