. 2012 Apr 17:7:12.
doi: 10.1186/1745-6150-7-12.

Domain enhanced lookup time accelerated BLAST

Affiliations

Domain enhanced lookup time accelerated BLAST

Grzegorz M Boratyn et al. Biol Direct. .

Abstract

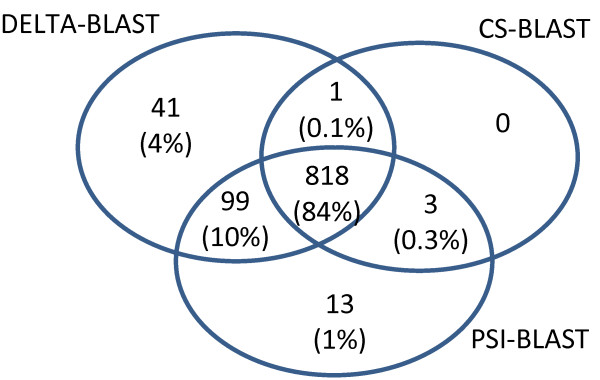
Background: BLAST is a commonly-used software package for comparing a query sequence to a database of known sequences; in this study, we focus on protein sequences. Position-specific-iterated BLAST (PSI-BLAST) iteratively searches a protein sequence database, using the matches in round i to construct a position-specific score matrix (PSSM) for searching the database in round i + 1. Biegert and Söding developed Context-sensitive BLAST (CS-BLAST), which combines information from searching the sequence database with information derived from a library of short protein profiles to achieve better homology detection than PSI-BLAST, which builds its PSSMs from scratch.

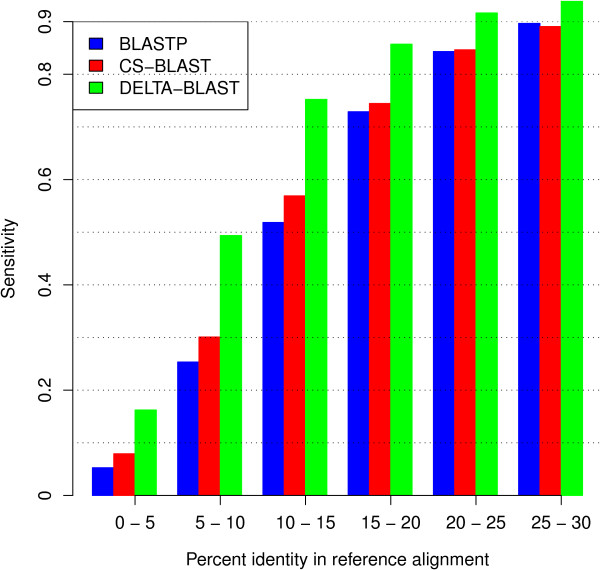
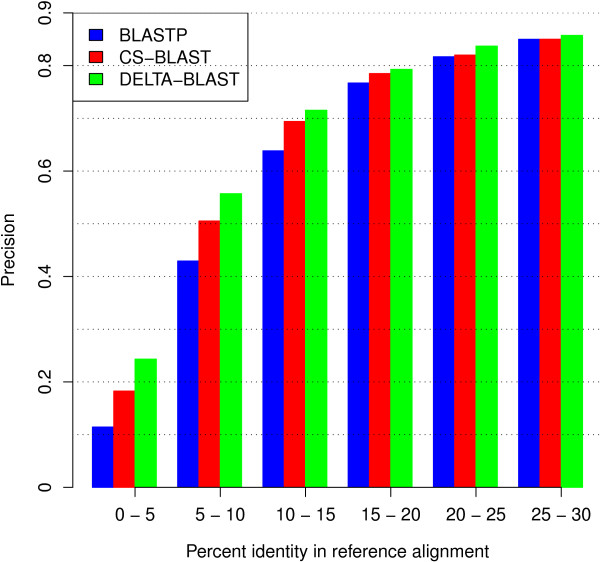
Results: We describe a new method, called domain enhanced lookup time accelerated BLAST (DELTA-BLAST), which searches a database of pre-constructed PSSMs before searching a protein-sequence database, to yield better homology detection. For its PSSMs, DELTA-BLAST employs a subset of NCBI's Conserved Domain Database (CDD). On a test set derived from ASTRAL, with one round of searching, DELTA-BLAST achieves a ROC5000 of 0.270 vs. 0.116 for CS-BLAST. The performance advantage diminishes in iterated searches, but DELTA-BLAST continues to achieve better ROC scores than CS-BLAST.

Conclusions: DELTA-BLAST is a useful program for the detection of remote protein homologs. It is available under the "Protein BLAST" link at http://blast.ncbi.nlm.nih.gov.


Figures

Figure 1
Figure 1
Overview of sequence search with DELTA-BLAST. DELTA-BLAST searches CDD with the supplied query, uses aligned domains to compute a PSSM and searches a sequence database with this PSSM.
Figure 2
Figure 2
Number of true positives vs. number of false positives for DELTA-BLAST, CS-BLAST and BLASTP. The searched database was created using ASTRAL 40 sequences for SCOP version 1.75. To create the query set, we sorted the SCOP domains in lexicographic order and selected even numbered sequences for the test query set. We excluded from the query set any sequence that was the sole member of its superfamily in ASTRAL 40. We considered a query and database sequence to be homologs if they belonged to the same superfamily, and non-homologs if they belonged to different folds. The search results generated by all queries were pooled and ordered by E-value. The database and the query set consisted of 10,569 and 4852 sequences, respectively.
Figure 3
Figure 3
Number of true positives vs. number of false positives for PSI-BLAST, iterated DELTA-BLAST, CSI-BLAST, DELTA-BLAST, and CS-BLAST. See the legend of Figure 2.
Figure 4
Figure 4
Percentage of queries exceeding a ROC5score vs. that score for DELTA-BLAST, BLASTP, CS-BLAST, PSI-BLAST, and CSI-BLAST. We computed a separate ROC5 score for the search results of each query and counted the number of queries that yield a ROC5 score above 0.1, 0.2, …, 0.9. See the legend of Figure 2 for data set description.
Figure 5
Figure 5
Alignment sensitivity of BLASTP, CS-BLAST, and DELTA-BLAST. Sensitivity measures the fraction of a reference alignment correctly recovered by a sequence alignment. Sequences and their reference alignments from the SABmark superfamily set were used to measure sensitivity. We used only reference alignments with sequence identity below 30% between sequences that did not correspond to SCOP domains present in the training set used to tune DELTA-BLAST parameters. Additionally, we removed reference alignments with fewer than five aligned pairs of residues. The data set contained 10,006 alignments between 2,379 sequences.
Figure 6
Figure 6
Alignment precision of BLASTP, CS-BLAST, and DELTA-BLAST. Precision measures the fraction of a sequence alignment that correctly reproduces a reference alignment. See the legend of Figure 5 for the data set description.
Figure 7
Figure 7
Average number of false positives as a function of nominal E-value. The plot shows the relationship between the nominal E-values reported by the search methods and actual E-values, estimated from search results. For a particular search method and nominal E-value x, the actual E-value is estimated by the mean number of false positive alignments returned with reported E-value ≤ x. The vertical dashed lines show nominal E-value thresholds at which the various search methods return 0.3 false positives per query (shown by the horizontal dashed line).
Figure 8
Figure 8
True positives for DELTA-BLAST, PSI-BLAST, and CS-BLAST. The Venn diagram shows the number of true positive results with nominal E-values below 0.01 for DELTA-BLAST, 0.015 for PSI-BLAST and 0.05 for CS-BLAST. The numbers in parentheses give percentages with respect to the total number of true positives found by all methods. Percentages do not sum precisely to 100% due to rounding.
Figure 9
Figure 9
True positives with query and subject sequences from different SCOP families. The Venn diagram shows the number of true positive results with nominal E-values below 0.01 for DELTA-BLAST, 0.015 for PSI-BLAST and 0.05 for CS-BLAST, in which query and subject belong to different SCOP families.
Figure 10
Figure 10
Number of SCOP superfamilies yielding at least one true positive alignment. The Venn diagram shows the number of SCOP superfamilies yielding at least one true positive result with nominal E-value below 0.01 for DELTA-BLAST, 0.015 for PSI-BLAST and 0.05 for CS-BLAST. Both query and subject sequence must come from the same superfamily.
Figure 11
Figure 11
Overview of computing the target frequencies for a PSSM position. Amino acid frequency profiles of conserved domains aligned to the query are added after weighting by the number of independent observations in domain models (shown as numbers next to the arrows). The query sequence is included, with one observation, in all positions where the query residue was not observed in any aligned domain.

References

    1. Altschul SF, Gish W, Miller W, Myers EW, Lipman DJ. Basic local alignment search tool. J Mol Biol. 1990;215:403–410. - PubMed
    1. Pearson WR, Lipman DJ. Improved tools for biological sequence comparison. Proc Natl Acad Sci USA. 1988;85:2444–2448. doi: 10.1073/pnas.85.8.2444. - DOI - PMC - PubMed
    1. Jones DT, Taylor WR, Thornton JM. A mutation data matrix for transmembrane proteins. FEBS Lett. 1994;339:269–275. doi: 10.1016/0014-5793(94)80429-X. - DOI - PubMed
    1. Ng PC, Henikoff JG, Henikoff S. PHAT: a transmembrane-specific substitution matrix. Bioinformatics. 2000;16:760–766. doi: 10.1093/bioinformatics/16.9.760. - DOI - PubMed
    1. Müller T, Rahmann S, Rehmsmeier M. Non-symmetric score matrices and the detection of homologous transmembrane proteins. Bioinformatics. 2001;17:S182–S189. doi: 10.1093/bioinformatics/17.suppl_1.S182. - DOI - PubMed

Publication types