. 2012 Aug;32(8):1567-77.
doi: 10.1038/jcbfm.2012.52. Epub 2012 Apr 18.

CD36 is involved in astrocyte activation and astroglial scar formation

Affiliations

CD36 is involved in astrocyte activation and astroglial scar formation

Yi Bao et al. J Cereb Blood Flow Metab. 2012 Aug.

Abstract

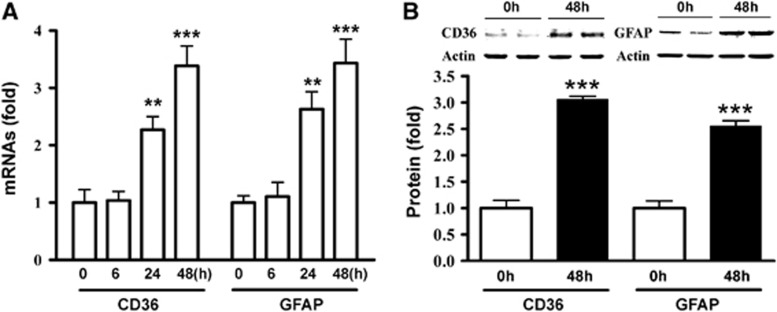
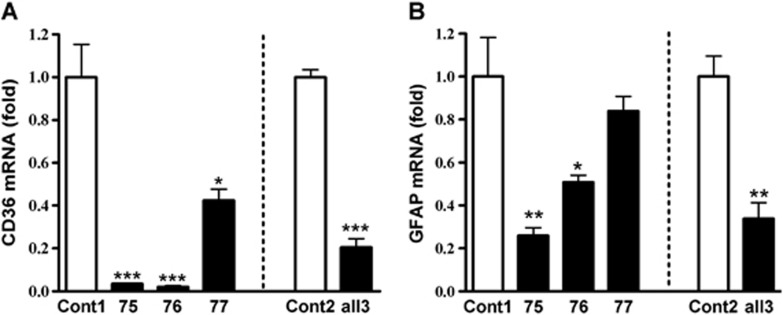
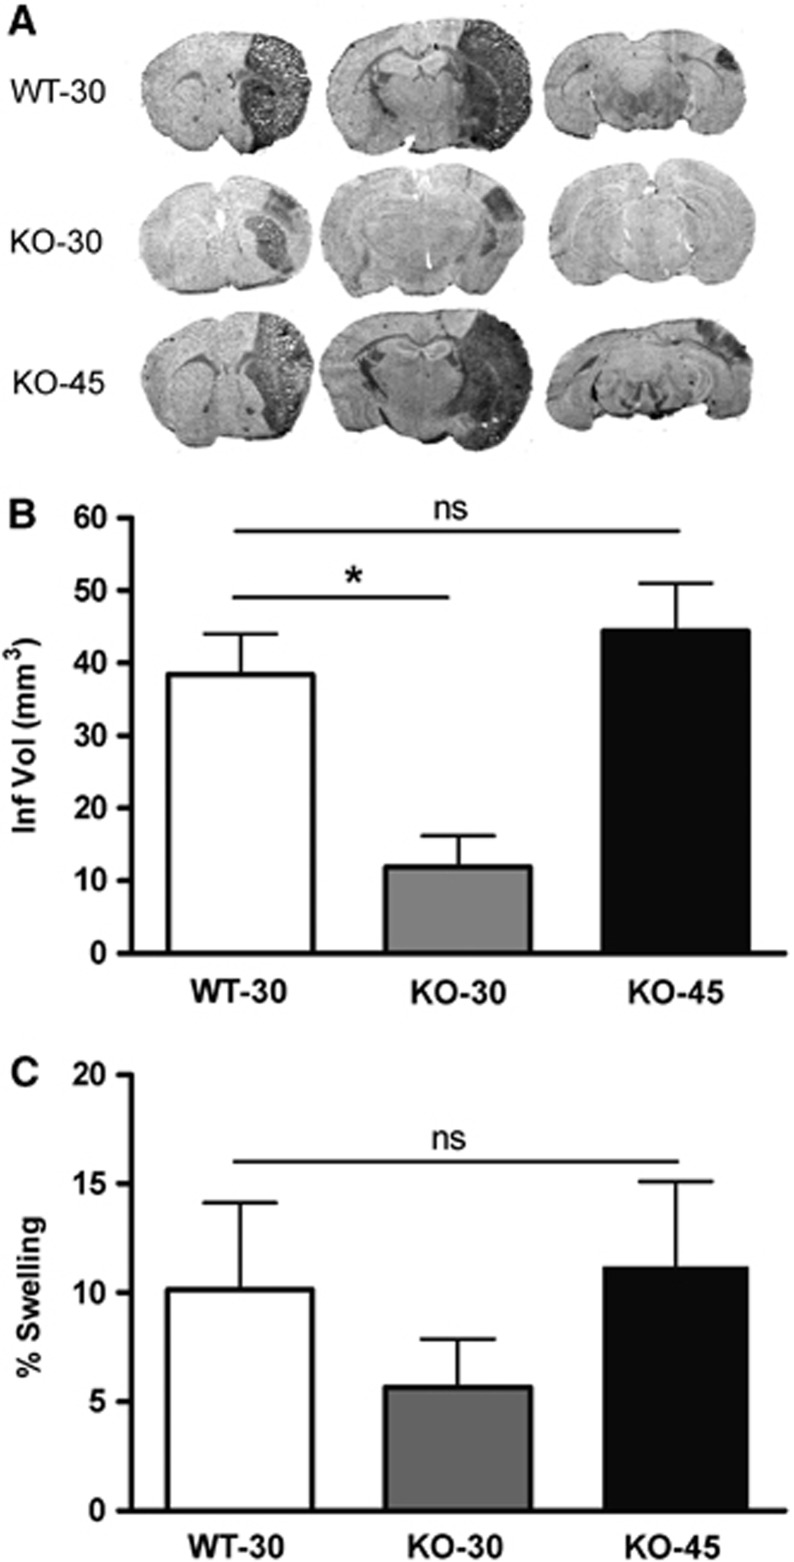
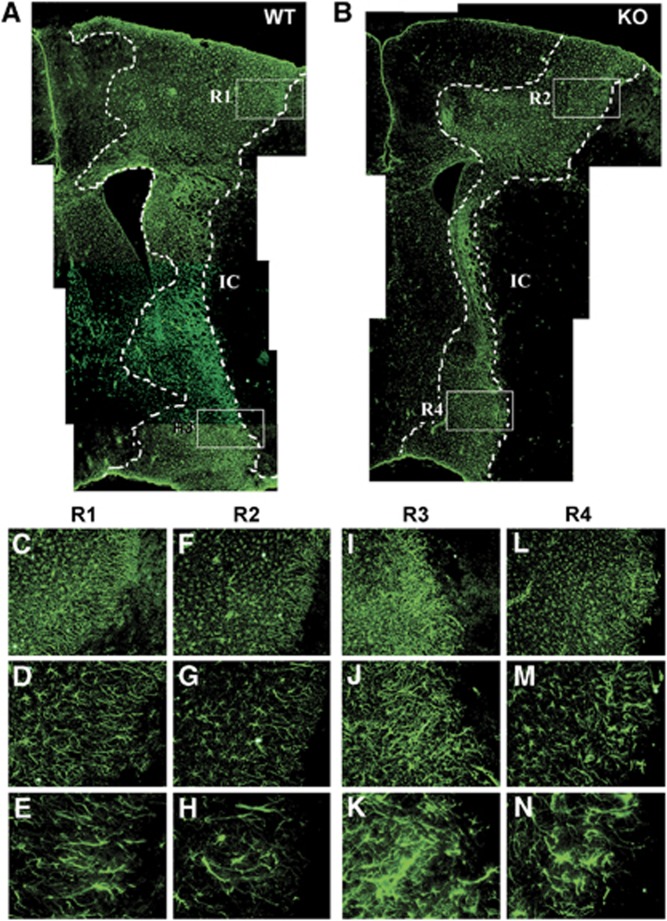
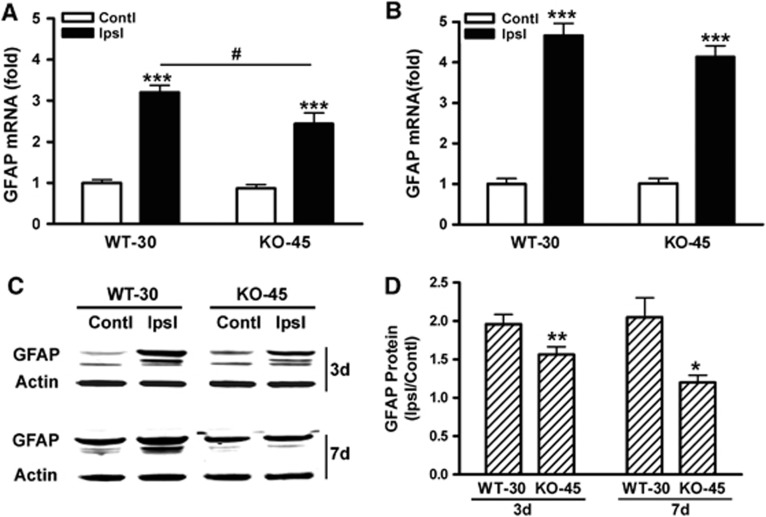
Inflammation is an essential component for glial scar formation. However, the upstream mediator(s) that triggers the process has not been identified. Previously, we showed that the expression of CD36, an inflammatory mediator, occurs in a subset of astcotyes in the peri-infarct area where the glial scar forms. This study investigates a role for CD36 in astrocyte activation and glial scar formation in stroke. We observed that the expression of CD36 and glial fibrillary acidic protein (GFAP) coincided in control and injured astrocytes and in the brain. Furthermore, GFAP expression was attenuated in CD36 small interfering RNA transfected astrocytes or in the brain of CD36 knockout (KO) mice, suggesting its involvement in GFAP expression. Using an in-vitro model of wound healing, we found that CD36 deficiency attenuated the proliferation of astrocytes and delayed closure of the wound gap. Furthermore, stroke-induced GFAP expression and scar formation were significantly attenuated in the CD36 KO mice compared with wild type. These findings identify CD36 as a novel mediator for injury-induced astrogliosis and scar formation. Targeting CD36 may serve as a potential strategy to reduce glial scar formation in stroke.


Figures

Figure 1
Figure 1
Coordinated expression of CD36 and glial fibrillary acidic protein (GFAP) expression in astrocytes. (A) Fold changes in CD36 and GFAP mRNA levels in C8-D1A astrocytes. 0 hours, control. (B) CD36 and GFAP protein levels in nonscratched control (0 hours) and 48 hours after scratch in C8-D1A cells. Values were expressed as mean±s.e.m. Three independent experiments were performed in triplicate. **P<0.01 and ***P<0.001 compared to respective 0 hours.
Figure 2
Figure 2
Reduced glial fibrillary acidic protein (GFAP) expression in CD36-silenced astrocytes. Effect of CD36 Stealth RNAi small interfering RNA (siRNA) on fold changes in CD36 (A) and GFAP (B) mRNA levels in C8-D1A cells. siRNA 75, 76, or 77 were applied either singly (20 nmol/L) or all together (all 3, 60 nmol/L for 20 nmol/L each) with respective controls (normalized as 1). Cells were collected after treatment of siRNA for 12 hours. Cont1, 20 nmol/L control siRNA, Cont2, 60 nmol/L control siRNA. *P<0.05, **P<0.01, and ***P<0.001 versus respective control (Cont1 or Cont2), n=3 to 6/group.
Figure 3
Figure 3
Delayed wound healing and inflammation in the absence of CD36. (A) Effect of CD36 small interfering RNA (siRNA) on cellular viability by MTT (3-(4,5-dimethylthiazol-2-yl)-2,5-diphenyltetrazolium bromide) assay. Cont, 20 nmol/L control siRNA; siRNA, 20 nmol/L CD36 siRNA. n=5/group. (B) Effect of CD36 siRNA on cell death by TUNEL (terminal deoxynucleotidyl transferase-mediated 2'-deoxyuridine 5'-triphosphate-biotin nick end labeling) staining n=4/group. Black arrowheads indicate TUNEL-positive cells. Scale bar, 50 μm. (C) Effect of CD36 siRNA on cellular proliferation and quantification. Representative images of Ki-67 and DAPI staining along the scratch edge in C8-D1A cultures treated with control siRNA (Cont) or CD36 siRNA 75 (siRNA) at 12 hours after scratch injury. White arrowheads indicate Ki-67+ cells. S indicated the scratch-induced gap area. The densities were calculated by dividing DAPI+ cells from the number of Ki-67+ cells and averaged in triplicates. Scale bar, 50 μm. n=4/group. (D) Effect of CD36 siRNA on wound healing. Representative images showed the effect of CD36 Stealth RNAi siRNA on the rate of wound closure following scratch. C8-D1A cells were transfected with CD36 siRNA 75 (20 nmol/L) or control siRNA (Cont) for 12 hours. Gaps were created by inserts and the area of gaps were quantified at 0, 24, and 48 hours. Scale bar, 500 μm. Quantification of gap area according to the wound field surface area. *P<0.05 versus Cont, n=3 to 4/group. (E) IL-6 and monocyte chemoattractant protein (MCP)-1 mRNA levels were increased in C8-D1A cells following mechanical scratch. β-Actin was used as an internal control. *P<0.05 and **P<0.01 versus 0 hours. (F) Effect of CD36 deficiency on scratch-induced IL-6 and MCP-1 expression in C8-D1A cells. The effect of CD36 Stealth RNAi siRNA 75/76/77 (all 3) on IL-6 and MCP-1 mRNA levels were determined 48 hours after scratch. siRNA and the control were treated for 12 hours before scratch. In all, 18 seconds rRNA was used as an internal control. Cont, 60 nmol/L control siRNA. *P<0.05, **P<0.01, and ***P<0.001 versus Cont.
Figure 4
Figure 4
Coordinated expression of CD36 and glial fibrillary acidic protein (GFAP) expression in normal brain. (A) Temporal expression of CD36 and GFAP expression in the brain during postnatal period. *P<0.05, **P<0.01, and ***P<0.001 versus 1 day. (B) Fold changes in GFAP mRNA levels in wild-type (WT) and CD36 knockout (KO) mice at 1 and 12 weeks. Data were expressed as GFAP/β-actin. β-Actin was used as an internal control. n=7 to 9/group. *P<0.05 versus WT. (C) Fold changes in GFAP protein levels in WT and CD36 KO mice at 1 and 12 weeks. Data were expressed as GFAP/actin. n=3 to 5/group. WT, wild-type mice; KO, CD36 KO mice. *P<0.05 versus WT.
Figure 5
Figure 5
Coordinated expression of stroke-induced CD36 and glial fibrillary acidic protein (GFAP) expression in the postischemic brain. Fold changes of CD36 mRNA (A), GFAP mRNA (B) in C57BL/6 mice following 30 minutes middle cerebral artery occlusion (MCAO). *P<0.05, **P<0.01, and ***P<0.001 versus corresponding Contl. Representatives of Western blot images and quantification of GFAP protein levels in C57BL/6 mice (C) and CD36 knockout (KO) mice (D) following 30 minutes MCAO. n=4/group. Note the similar temporal expression profiles between CD36 and GFAP. Contralateral side of sham was normalized as 1. Contl, contralateral side; Ipsl, ipsilateral side. *P<0.05 and **P<0.01 versus corresponding Contl.
Figure 6
Figure 6
Effect of CD36 on stroke outcome. (A) Representative phase contrast images in wild-type (WT) and CD36 knockout (KO) mice. Assessment of infarct volume (B) and percent hemispheric swelling (C) 3 days after 30 minutes middle cerebral artery occlusion (MCAO) in WT and 30 or 45 minutes MCAO in CD36 KO mice. Note that extending ischemic duration to 45 minutes in CD36 KO mice resulted in an infarct size comparable to that in WT mice subjected to 30 minutes MCAO. WT-30, WT mice with a 30-minute MCAO (n=11); KO-30, CD36 KO mice with a 30-minute MCAO (n=5); KO-45, CD36 KO mice with a 45-minute MCAO (n=8). *P<0.05 versus WT-30.
Figure 7
Figure 7
Stroke-induced glial scar formation is attenuated in CD36 knockout (KO) mice. Composite of low magnification of glial fibrillary acidic protein (GFAP) immunohistochemistry micrographs ( × 4) from wild-type (WT) (A) and CD36 KO (B) brains 7 days after ischemia. The mice exhibit similar infarct size (WT, 32.1 mm3, CD36 KO 34.0 mm3). Note that there is an overall reduction in GFAP immunoreactivity in the CD36 KO brain. The dotted lines indicate the boundary of glial scar. IC, Infarct core. (CN) Higher magnification micrographs of GFAP immunoreactivity; × 10 (C, F, I, L), × 20 (D, G, J, M), and × 40 (E, H, K, N) indicated with white boxes indicate four different regions of interest (R) in panels A, B, and obtained from WT (CE for R1 and IK for R3) and CD36 KO mice for the corresponding regions (FH for R2 and LN for R4). n=2/group.
Figure 8
Figure 8
CD36 deficiency reduces glial fibrillary acidic protein (GFAP) expression in the postischemic brain. Fold changes in GFAP mRNA levels in the brains of wild-type (WT) and CD36 knockout (KO) mice at 3 (A) and 7 days (B) after stroke. Data were expressed as GFAP/β-actin. Contl, contralateral side; Ipsl, ipsilateral side, ***P<0.001 versus Contl, #P<0.05 versus WT-30 Ipsl. n=5 to 8/group. (C, D) GFAP protein levels in the postischemic brain. Values were expressed as a ratio of ipsilateral/contralateral levels. *P<0.05 and **P<0.01 versus WT-30. n=4 to 8/group.

References

    1. Askalan R, Deveber G, Ho M, Ma J, Hawkins C. Astrocytic-inducible nitric oxide synthase in the ischemic developing human brain. Pediatr Res. 2006;60:687–692. - PubMed
    1. Bamboat ZM, Balachandran VP, Ocuin LM, Obaid H, Plitas G, DeMatteo RP. Toll-like receptor 9 inhibition confers protection from liver ischemia-reperfusion injury. Hepatology. 2010a;51:621–632. - PMC - PubMed
    1. Bamboat ZM, Ocuin LM, Balachandran VP, Obaid H, Plitas G, DeMatteo RP. Conventional DCs reduce liver ischemia/reperfusion injury in mice via IL-10 secretion. J Clin Invest. 2010b;120:559–569. - PMC - PubMed
    1. Bush TG, Puvanachandra N, Horner CH, Polito A, Ostenfeld T, Svendsen CN, Mucke L, Johnson MH, Sofroniew MV. Leukocyte infiltration, neuronal degeneration, and neurite outgrowth after ablation of scar-forming, reactive astrocytes in adult transgenic mice. Neuron. 1999;23:297–308. - PubMed
    1. Cho S, Kim E. CD36: a multi-modal target for acute stroke therapy. J Neurochem. 2009;109 (Suppl 1:126–132. - PMC - PubMed

Publication types

MeSH terms

Substances