. 2012 Jun 1;44(11):607-21.
doi: 10.1152/physiolgenomics.00001.2012. Epub 2012 Apr 17.

Entrainment of peripheral clock genes by cortisol

Affiliations

Entrainment of peripheral clock genes by cortisol

Panteleimon D Mavroudis et al. Physiol Genomics. .

Abstract

Circadian rhythmicity in mammals is primarily driven by the suprachiasmatic nucleus (SCN), often called the central pacemaker, which converts the photic information of light and dark cycles into neuronal and hormonal signals in the periphery of the body. Cells of peripheral tissues respond to these centrally mediated cues by adjusting their molecular function to optimize organism performance. Numerous systemic cues orchestrate peripheral rhythmicity, such as feeding, body temperature, the autonomic nervous system, and hormones. We propose a semimechanistic model for the entrainment of peripheral clock genes by cortisol as a representative entrainer of peripheral cells. This model demonstrates the importance of entrainer's characteristics in terms of the synchronization and entrainment of peripheral clock genes, and predicts the loss of intercellular synchrony when cortisol moves out of its homeostatic amplitude and frequency range, as has been observed clinically in chronic stress and cancer. The model also predicts a dynamic regime of entrainment, when cortisol has a slightly decreased amplitude rhythm, where individual clock genes remain relatively synchronized among themselves but are phase shifted in relation to the entrainer. The model illustrates how the loss of communication between the SCN and peripheral tissues could result in desynchronization of peripheral clocks.


Figures
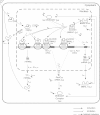
Fig. 1.
Fig. 1.
Schematic figure of the model. Two components formulate the framework of the model. The 1st is a pharmacodynamic compartment through which cortisol F diffuses to cytoplasm, binds the glucocorticoid receptor (R), forming the complex FR, translocates to the nucleus FR(N), and regulates the translation of mRNAR and Per/Cry mRNA, and the 2nd includes the clock gene regulatory positive and negative feedback loops (y1y7).
Fig. 2.
Fig. 2.
Distribution of single cell phases and periods when no entrainer is present. A: unentrained single cell phases adopt a uniform distribution possessing values through the entire regime from 0 to 2π. B: individual cell periods adopt a normally distributed pattern with mean period equal to 23.4 h.
Fig. 3.
Fig. 3.
Cortisol entrainment to Per/Cry mRNA (y1) compartment (1,000 cells). Ensemble average profile of Per/Cry mRNA (y1) before and after the presence of cortisol. Cortisol entrainment (200 < t < 1,000 h) results in a robust expression signal at the population level in contrast with desynchronized states (t < 200 and t > 1,000 h) where the population signal is weaker.
Fig. 4.
Fig. 4.
Cortisol's amplitude dependent synchronization of peripheral cells (1,000 cells). In small cortisol amplitudes (I) individual cells are desynchronized as it is denoted by the small values of Rsyn,1, ρ1, and the high standard deviation of cell phases (σΦPer/Cry mRNA). As cortisol amplitude approaches its homeostatic value, individual cells pass through an intermediate regime of synchronization (II), where some of the cells are gradually becoming synchronized. Regime III corresponds to the entrained state of the population where the cells are nearly fully synchronized as it is denoted by the high values of Rsyn,1 and ρ1 metrics and the low value of σΦPer/Cry mRNA.
Fig. 5.
Fig. 5.
Distribution of individual cell phases (ΦPer/Cry mRNA) for 8 cortisol amplitudes (1,000 cells). While in large cortisol amplitudes (amp = 1 − Fmin/Fmax) distribution of single cell phases adopt a normally distributed pattern, as the amplitude of cortisol decreases, the normal distribution becomes gradually uniform. From A to H cortisol amplitude is decreasing. μ and σ are the mean and standard deviation of population phases, respectively.
Fig. 6.
Fig. 6.
Distribution of individual cell periods for 8 cortisol amplitudes (1,000 cells). In large cortisol amplitudes (amp = 1 − Fmin/Fmax), distribution of cell periods adopt a narrow distribution centered around the circadian period of the entrainer (24 h). As the amplitude decreases, a 2nd distribution of cell periods surges, which ultimately becomes the solely distribution of the population. From A to H cortisol amplitude is decreasing. μ and σ are the mean and standard deviation of population periods, respectively.
Fig. 7.
Fig. 7.
Cortisol's frequency dependent synchronization of peripheral cells (1,000 cells). Synchronization as calculated with Rsyn,1 and ρ1 metrics is observed only for entrainer periods relatively close to the individual cell period (23.4 h).
Fig. 8.
Fig. 8.
Distribution of individual cell's phases for several cortisol periods (1,000 cells). As entrainer period remain highly different than that of individual cells (23.4 h), the cell phases adopt a uniform distribution. For cortisol periods close to that of individual cells, there is a gradual concentration of phases under a normal distribution. From A to F cortisol period is increasing. μ and σ are the mean and standard deviation of population periods, respectively.
Fig. 9.
Fig. 9.
Distribution of individual cell periods for several cortisol periods (1,000 cells). As cortisol period approaches or departs from the period of individual cells (23.4 h) we see the rise of a 2nd distribution denoting that cells are gradually becoming synchronized or desynchronized respectively. From A to F cortisol period is increasing. μ and σ are the mean and standard deviation of population periods, respectively.
Fig. 10.
Fig. 10.
Circadian variation of clock gene synchronization throughout a 24 h period. A: individual cell Per/Cry mRNA expression for homeostatic cortisol rhythms. The synchronization metric (Rsyn,1) has been calculated for consecutive time windows of 2 h and has been placed over each time interval. Different colors denote different windows where the metric has been calculated. B: representation of a small number of cells for the 6–8 h window that indicates the highly uncorrelated profiles of single cells. C: a small number of cell profiles for the regime of maximum desynchronization (12–14 h). D: a small number of cells for a regime of high synchronization (18–20 h). The x- and y-axes of the inset plots are same to these of the main figure A.

References

    1. Abraham U, Granada AE, Westermark PO, Heine M, Kramer A, Herzel H. Coupling governs entrainment range of circadian clocks. Mol Syst Biol 6: 438, 2010 - PMC - PubMed
    1. An G. In silico experiments of existing and hypothetical cytokine-directed clinical trials using agent-based modeling. Crit Care Med 32: 2050–2060, 2004 - PubMed
    1. An G. Introduction of an agent-based multi-scale modular architecture for dynamic knowledge representation of acute inflammation. Theor Biol Med Model 5: 11, 2008 - PMC - PubMed
    1. Antle MC, Foley DK, Foley NC, Silver R. Gates and oscillators: a network model of the brain clock. J Biol Rhythms 18: 339–350, 2003 - PMC - PubMed
    1. Antle MC, Foley NC, Foley DK, Silver R. Gates and oscillators II: zeitgebers and the network model of the brain clock. J Biol Rhythms 22: 14–25, 2007 - PMC - PubMed

Publication types

LinkOut - more resources