

Metabolic signatures of insulin resistance in 7,098 young adults
- PMID: 22511205
- PMCID: PMC3357275
- DOI: 10.2337/db11-1355
Metabolic signatures of insulin resistance in 7,098 young adults
Abstract
Metabolite associations with insulin resistance were studied in 7,098 young Finns (age 31 ± 3 years; 52% women) to elucidate underlying metabolic pathways. Insulin resistance was assessed by the homeostasis model (HOMA-IR) and circulating metabolites quantified by high-throughput nuclear magnetic resonance spectroscopy in two population-based cohorts. Associations were analyzed using regression models adjusted for age, waist, and standard lipids. Branched-chain and aromatic amino acids, gluconeogenesis intermediates, ketone bodies, and fatty acid composition and saturation were associated with HOMA-IR (P < 0.0005 for 20 metabolite measures). Leu, Ile, Val, and Tyr displayed sex- and obesity-dependent interactions, with associations being significant for women only if they were abdominally obese. Origins of fasting metabolite levels were studied with dietary and physical activity data. Here, protein energy intake was associated with Val, Phe, Tyr, and Gln but not insulin resistance index. We further tested if 12 genetic variants regulating the metabolites also contributed to insulin resistance. The genetic determinants of metabolite levels were not associated with HOMA-IR, with the exception of a variant in GCKR associated with 12 metabolites, including amino acids (P < 0.0005). Nonetheless, metabolic signatures extending beyond obesity and lipid abnormalities reflected the degree of insulin resistance evidenced in young, normoglycemic adults with sex-specific fingerprints.
Figures
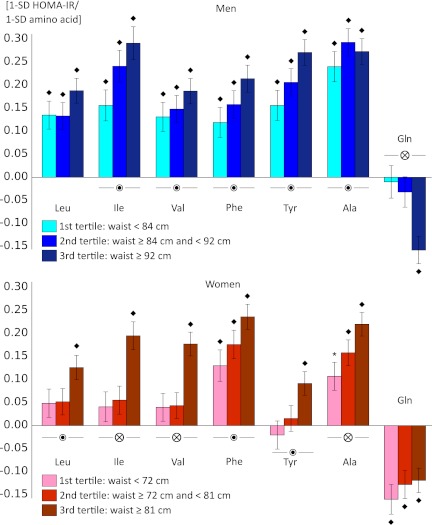
 P < 0.05; ⊗P < 0.0005 for amino acid × waist interaction, indicating different slopes across tertiles of waist circumference.
References
-
- Kahn SE, Hull RL, Utzschneider KM. Mechanisms linking obesity to insulin resistance and type 2 diabetes. Nature 2006;444:840–846 - PubMed
-
- Lillioja S, Mott DM, Spraul M, et al. Insulin resistance and insulin secretory dysfunction as precursors of non-insulin-dependent diabetes mellitus. Prospective studies of Pima Indians. N Engl J Med 1993;329:1988–1992 - PubMed
-
- Raitakari OT, Porkka KV, Rönnemaa T, et al. The role of insulin in clustering of serum lipids and blood pressure in children and adolescents. The Cardiovascular Risk in Young Finns Study. Diabetologia 1995;38:1042–1050 - PubMed
-
- Moran A, Jacobs DR, Jr, Steinberger J, et al. Changes in insulin resistance and cardiovascular risk during adolescence: establishment of differential risk in males and females. Circulation 2008;117:2361–2368 - PubMed
Publication types
MeSH terms
Substances
Grants and funding
LinkOut - more resources
Full Text Sources
Medical
