

Connexin-36 gap junctions regulate in vivo first- and second-phase insulin secretion dynamics and glucose tolerance in the conscious mouse
- PMID: 22511206
- PMCID: PMC3379660
- DOI: 10.2337/db11-1312
Connexin-36 gap junctions regulate in vivo first- and second-phase insulin secretion dynamics and glucose tolerance in the conscious mouse
Abstract
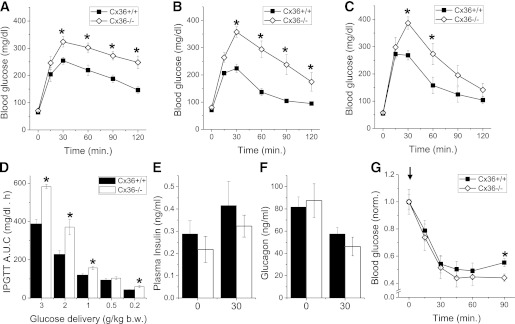
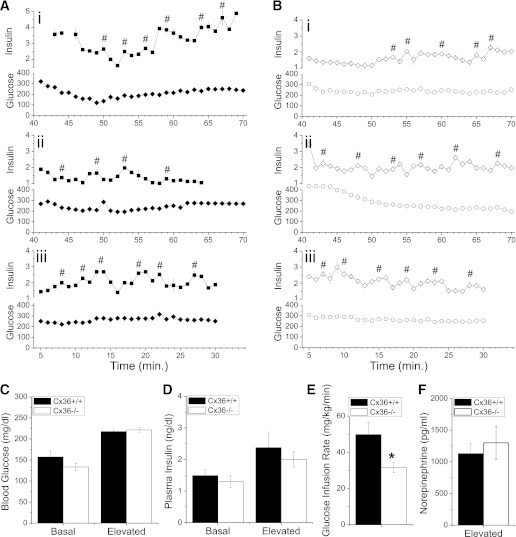
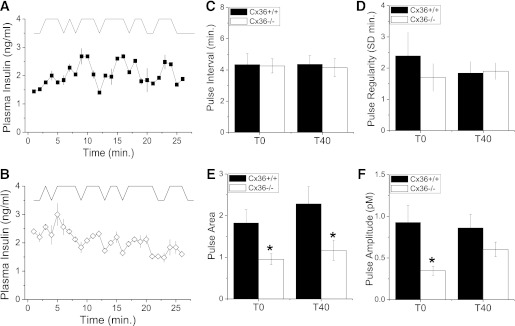
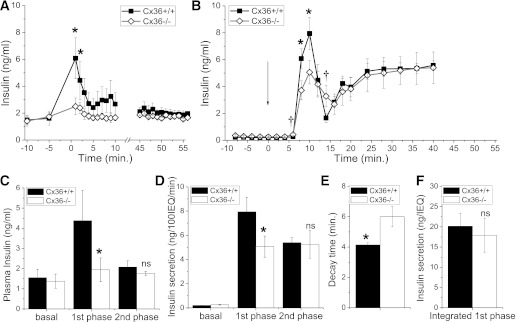
Insulin is secreted from the islets of Langerhans in coordinated pulses. These pulses are thought to lead to plasma insulin oscillations, which are putatively more effective in lowering blood glucose than continuous levels of insulin. Gap-junction coupling of β-cells by connexin-36 coordinates intracellular free calcium oscillations and pulsatile insulin release in isolated islets, however a role in vivo has not been shown. We test whether loss of gap-junction coupling disrupts plasma insulin oscillations and whether this impacts glucose tolerance. We characterized the connexin-36 knockout (Cx36(-/-)) mouse phenotype and performed hyperglycemic clamps with rapid sampling of insulin in Cx36(-/-) and control mice. Our results show that Cx36(-/-) mice are glucose intolerant, despite normal plasma insulin levels and insulin sensitivity. However, Cx36(-/-) mice exhibit reduced insulin pulse amplitudes and a reduction in first-phase insulin secretion. These changes are similarly found in isolated Cx36(-/-) islets. We conclude that Cx36 gap junctions regulate the in vivo dynamics of insulin secretion, which in turn is important for glucose homeostasis. Coordinated pulsatility of individual islets enhances the first-phase elevation and second-phase pulses of insulin. Because these dynamics are disrupted in the early stages of type 2 diabetes, dysregulation of gap-junction coupling could be an important factor in the development of this disease.
Figures
Comment in
-
The in vivo β-to-β-cell chat room: connexin connections matter.Diabetes. 2012 Jul;61(7):1656-8. doi: 10.2337/db12-0336. Diabetes. 2012. PMID: 22723271 Free PMC article. No abstract available.
References
-
- Lang DA, Matthews DR, Peto J, Turner RC. Cyclic oscillations of basal plasma glucose and insulin concentrations in human beings. N Engl J Med 1979;301:1023–1027 - PubMed
-
- Jaspan JB, Lever E, Polonsky KS, Van Cauter E. In vivo pulsatility of pancreatic islet peptides. Am J Physiol 1986;251:E215–E226 - PubMed
-
- Nunemaker CS, Wasserman DH, McGuinness OP, Sweet IR, Teague JC, Satin LS. Insulin secretion in the conscious mouse is biphasic and pulsatile. Am J Physiol Endocrinol Metab 2006;290:E523–E529 - PubMed
-
- Song SH, Kjems L, Ritzel R, et al. Pulsatile insulin secretion by human pancreatic islets. J Clin Endocrinol Metab 2002;87:213–221 - PubMed
-
- Bergsten P. Slow and fast oscillations of cytoplasmic Ca2+ in pancreatic islets correspond to pulsatile insulin release. Am J Physiol 1995;268:E282–E287 - PubMed
Publication types
MeSH terms
Substances
Grants and funding
- U24 DK076169/DK/NIDDK NIH HHS/United States
- P60 DK020593/DK/NIDDK NIH HHS/United States
- R01 DK046409/DK/NIDDK NIH HHS/United States
- P30 DK058404/DK/NIDDK NIH HHS/United States
- R01-DK-46409/DK/NIDDK NIH HHS/United States
- HD-15052/HD/NICHD NIH HHS/United States
- P30 EY008126/EY/NEI NIH HHS/United States
- P30 DK020593/DK/NIDDK NIH HHS/United States
- R00 DK085145/DK/NIDDK NIH HHS/United States
- P30 CA068485/CA/NCI NIH HHS/United States
- P30 DK020572/DK/NIDDK NIH HHS/United States
- R01-DK-053434/DK/NIDDK NIH HHS/United States
- DK-59637/DK/NIDDK NIH HHS/United States
- EY-08126/EY/NEI NIH HHS/United States
- CA-68485/CA/NCI NIH HHS/United States
- DK-58404/DK/NIDDK NIH HHS/United States
- P30-DK-20593/DK/NIDDK NIH HHS/United States
- U24-DK-076169/DK/NIDDK NIH HHS/United States
- DK-20593/DK/NIDDK NIH HHS/United States
- P30 HD015052/HD/NICHD NIH HHS/United States
- K99 DK085145/DK/NIDDK NIH HHS/United States
- U24-DK-59637/DK/NIDDK NIH HHS/United States
- R01 DK053434/DK/NIDDK NIH HHS/United States
- U24 DK059637/DK/NIDDK NIH HHS/United States
- K99-DK-085145/DK/NIDDK NIH HHS/United States
LinkOut - more resources
Full Text Sources
Other Literature Sources
Medical
Molecular Biology Databases
Miscellaneous
