. 2012 Jun 1;287(23):19516-27.
doi: 10.1074/jbc.M111.337428. Epub 2012 Apr 16.

PTTG1 oncogene promotes tumor malignancy via epithelial to mesenchymal transition and expansion of cancer stem cell population

Affiliations

PTTG1 oncogene promotes tumor malignancy via epithelial to mesenchymal transition and expansion of cancer stem cell population

Chang-Hwan Yoon et al. J Biol Chem. .

Abstract

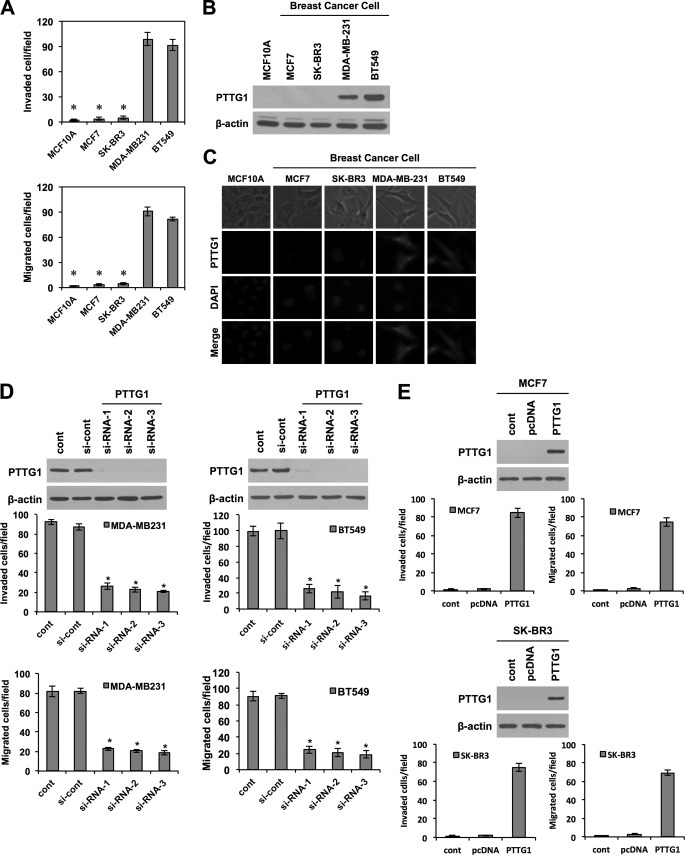
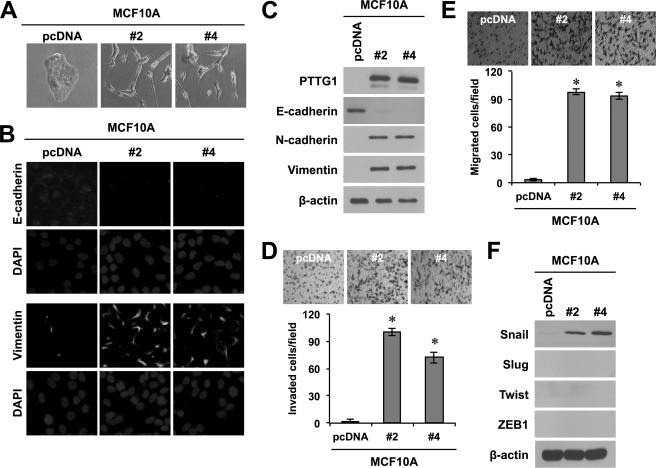
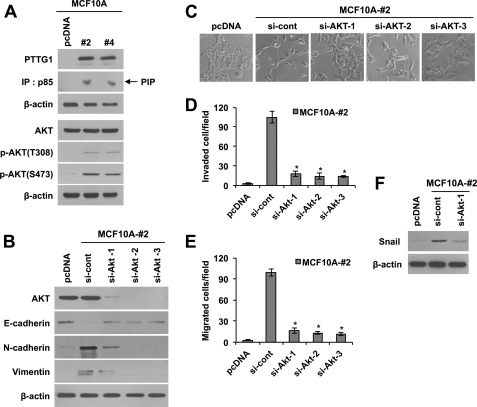
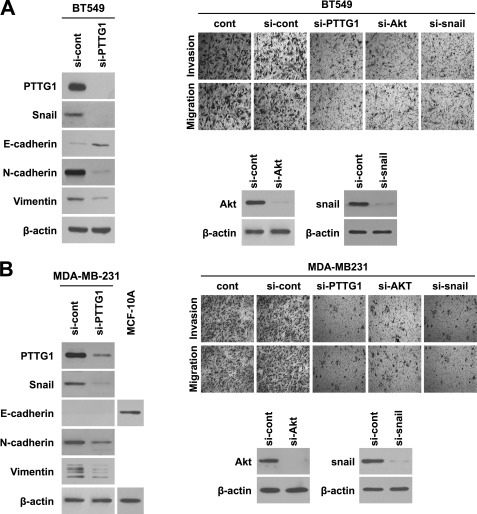
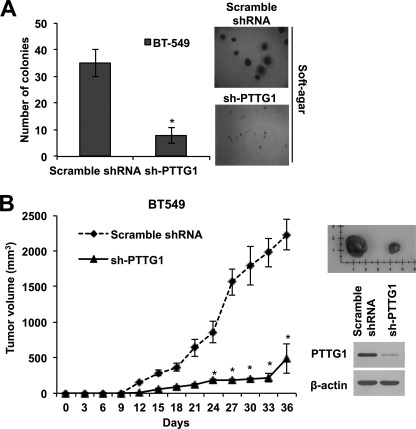
The prognosis of breast cancer patients is related to the degree of metastasis. However, the mechanisms by which epithelial tumor cells escape from the primary tumor and colonize at a distant site are not entirely understood. Here, we analyzed expression levels of pituitary tumor-transforming gene-1 (PTTG1), a relatively uncharacterized oncoprotein, in patient-derived breast cancer tissues with corresponding normal breast tissues. We found that PTTG1 is highly expressed in breast cancer patients, compared with normal tissues. Also, PTTG1 expression levels were correlated with the degree of malignancy in breast cancer cell lines; the more migratory and invasive cancer cell lines MDA-MB-231 and BT549 displayed the higher expression levels of PTTG1 than the less migratory and invasive MCF7 and SK-BR3 and normal MCF10A cell lines. By modulating PTTG1 expression levels, we found that PTTG1 enhances the migratory and invasive properties of breast cancer cells by inducing epithelial to mesenchymal transition, as evidenced by altered morphology and epithelial/mesenchymal cell marker expression patterns and up-regulation of the transcription factor Snail. Notably, down-regulation of PTTG1 also suppressed cancer stem cell population in BT549 cells by decreasing self-renewing ability and tumorigenic capacity, accompanying decreasing CD44(high) CD24(low) cells and Sox2 expression. Up-regulation of PTTG1 had the opposite effects, increasing sphere-forming ability and Sox2 expression. Importantly, PTTG1-mediated malignant tumor properties were due, at least in part, to activation of AKT, known to be a key regulator of both EMT and stemness in cancer cells. Collectively, these results suggest that PTTG1 may represent a new therapeutic target for malignant breast cancer.


Figures

FIGURE 1.
FIGURE 1.
Correlation of PTTG1 expression with poor prognosis in breast cancer patients. A, tissue array containing breast cancer with normal counterpart tissues was immunostained with PTTG1 antibody. High expression levels of PTTG1 were shown in 9 of 11 cases of breast cancer tissues, compared with normal breast tissues. Representative images of three cases in normal breast tissues (upper) and breast cancer tissues (lower) are shown. Photomicrograph (×20 magnification) was taken by IX71 microscope (Olympus, Tokyo, Japan) equipped with DP71 digital imaging system (Olympus). B, Kaplan-Meier plot of human breast cancer patients using publicly available clinical breast cancer data. Breast cancer patients (2324) were grouped to high (1162) and low expression (1162) of PTTG1. Note that PTTG1 expression levels have strong correlation with poor prognosis and low survival rate.
FIGURE 2.
FIGURE 2.
PTTG1 expression in malignant breast cancer cells. A, invasive (upper) and migratory (lower) properties of various breast cancer cell lines (MDA-MB-231, BT549, MCF7, and SK-BR3) and the normal breast cell line (MCF10A) were analyzed in trans-well by counting migrated cells in randomly selected five microscopic fields per well. Western blots (B) and immunocytochemistry (C) show that MDA-MB-231 and BT549 cells express higher levels of PTTG1 than MCF10A, MCF7, and SK-BR3. β-Actin was used as the loading control in Western blot. C, immunocytochemistry. MDA-MB-231 and BT549 cells express higher levels of PTTG1 expression than MCF10A, MCF7, and SK-BR3. D and E, transfection with three different PTTG1-targeting siRNAs (D) attenuated migratory and invasive properties of MDA-MB-231 and BT549 cells, compared with transfection with control siRNA (si-cont). Transfection with PTTG1 (E) promoted migratory and invasive properties of MCF7 and SK-BR2 cells, compared with transfection with control vector, pcDNA. Invasive and migratory properties were analyzed in trans-well by counting migrated cells in randomly selected five microscopic fields per well. All error bars represent mean ± S.D. of triplicate samples. *, p < 0.001.
FIGURE 3.
FIGURE 3.
Ectopic expression of PTTG1 promotes acquisition of invasive and migratory properties by normal breast cells. A, ectopic expression of PTTG1 in MCF10A cells induced morphological changes to a more spindle shape and increased the spacing between cells. Representative phase-contrast images of MCF10A-PTTG1 (clone #2 and #4) and control vector, pcDNA-transfected cells are shown. B, immunocytochemistry. PTTG1 overexpression results in loss of membrane E-cadherin and gain of membrane N-cadherin by immunofluorescence analysis (magnification, ×400). C, Western blots. Expression of PTTG1 results in loss of E-cadherin and gain of N-cadherin and vimentin. β-actin is used to show equal loading. D and E, MCF10A cells acquired invasive (D) and migratory properties (E) by ectopic expression of PTTG1. Invasive and migratory properties were analyzed in trans-well by counting migrated cells in randomly selected five microscopic fields per well. Error bars represent mean ± S.D. of triplicate samples. F, Western blots. Expression of PTTG1 induced transcription factor, Snail. However, expression levels of Slug, Twist, and ZEB1 were not changed by PTTG1 expression. β-Actin is used to show equal loading. *, p < 0.001.
FIGURE 4.
FIGURE 4.
PTTG1 induces EMT via PI3K/Akt signaling. A, Western blots. PTTG1 expression led to an increase of phosphorylated AKT at Thr-308 and Ser-473 in MCF10A cells. PI3K assay showed that PTTG1 expression increases the activity of p85, a component of PI3K. β-Actin was used as the loading control. IP, immunoprecipitation. B, Western blots. Transfection of PTTG1-expressing MCF10A (clone #2) with three different Akt-targeting siRNAs decreased epithelial marker, E-cadherin, and increased mesenchymal markers, N-cadherin and vimentin. β-Actin was used as the loading control. C, transfection of PTTG1-expressing MCF10A (clone #2) with three different Akt-targeting siRNAs recovered cell morphology to MCF10A cells. Representative phase-contrast images are shown. D and E, treatment with three different sRNA targeting AKT suppressed invasive (D) and migratory properties (E) of PTTG1-expressing MCF10A cells (clone #2). Invasive and migratory properties were analyzed in trans-well by counting migrated cells in randomly selected five microscopic fields per well. Error bars represent mean ± S.D. of triplicate samples. *, p < 0.001, versus control. F, Western blots. Treatment with siRNA targeting AKT attenuated PTTG1-induced expression of Snail in PTTG1-expressing MCF10A cells (clone #2). β-Actin was used as the loading control.
FIGURE 5.
FIGURE 5.
PTTG1 induces EMT via AKT signaling and Snail in breast cancer cells. A and B, transfection with siRNA targeting PTTG1 increased epithelial marker, E-cadherin, and decreased transcription factor Snail and mesenchymal markers, N-cadherin and vimentin in BT549 (A) and MDA-MB-231 (B), that express high levels of PTTG1. Detection of E-cadherin failed in mesenchymal phenotype MDA-MB-231 cells. MCF10A cells lysate was loaded as a positive control of E-cadherin. Treatment of BT549 (A) and MDA-MB-231 cells (B) with either siRNA targeting PTTG1, AKT, or Snail suppressed invasive and migratory properties. Invasive and migratory properties were analyzed in trans-well by counting migrated cells in randomly selected five microscopic fields per well. Representative phase-contrast images are shown. β-Actin was used as the loading control. *, p < 0.001.
FIGURE 6.
FIGURE 6.
PTTG1 regulates the breast cancer stem cell population. A, measurement of sphere sizes after treatment with shRNA targeted to PTTG1 for 72 h in BT549 cells. Sixty spheres per group were randomly taken to measure the size. B, clonal analysis of sphere-forming cells at single cell levels after treatment with shRNA targeting of PTTG1. C, quantification of breast cancer stem cell population by FACS. CD44high CD24low cell population was drastically increased in sphere-cultured conditions; however, treatment with shRNA targeting of PTTG1 suppressed CD44high CD24low cell population in sphere-cultured BT549 cells. D, treatment with shRNA targeting of PTTG1 decreased stemness-regulating transcription factor Sox2, but not Oct4 and Nanog. Error bars represent mean ± S.D. *, p < 0.001.
FIGURE 7.
FIGURE 7.
Down-regulation of PTTG1 decreases tumorigenic capacity. A, soft agar colony assay after transduction of breast cancer BT549 cells with shRNA targeting of PTTG1 (sh-PTTG1). Down-regulation of PTTG1 suppressed the colony-forming ability of BT549 cells. The number of colony was counted in randomly selected four microscopic fields per plate. Photomicrographs were taken at magnification ×200. Error bars represent mean ± S.D. of four different fields. *, p < 0.001, versus control. B, tumorigenic capacity in vivo. BT549 (2 × 10⁶ cells/ml) cells were transfected with either control scrambled shRNA or shRNA targeting of PTTG1. Transfected cells were then subcutaneously inoculated to the right flank of athymic BALB/c female nude mice (5 weeks of age, n = 4 per group). Tumor formation was dramatically attenuated 2 weeks after implantation in mice transplanted with BT549 cells treated with shRNA-PTTG1, compared with those implanted with scrambled shRNA-treated cells. Representative photo shows differential volume of tumor at 36 days after implantation. Error bars represent mean ± S.D. *, p < 0.001, versus control.

References

    1. Chaffer C. L., Weinberg R. A. (2011) A perspective on cancer cell metastasis. Science 331, 1559–1564 - PubMed
    1. Liang X. (2011) EMT. New signals from the invasive front. Oral Oncol. 47, 686–687 - PubMed
    1. Christofori G. (2006) New signals from the invasive front. Nature 441, 444–450 - PubMed
    1. Singh A., Settleman J. (2010) EMT, cancer stem cells and drug resistance. An emerging axis of evil in the war on cancer. Oncogene 29, 4741–4751 - PMC - PubMed
    1. Karreth F., Tuveson D. A. (2004) Twist induces an epithelial-mesenchymal transition to facilitate tumor metastasis. Cancer Biol. Ther. 3, 1058–1059 - PubMed

Publication types

MeSH terms