. 2012;8(4):e1002480.
doi: 10.1371/journal.pcbi.1002480. Epub 2012 Apr 12.

Mapping the environmental fitness landscape of a synthetic gene circuit

Affiliations

Mapping the environmental fitness landscape of a synthetic gene circuit

Dmitry Nevozhay et al. PLoS Comput Biol. 2012.

Abstract

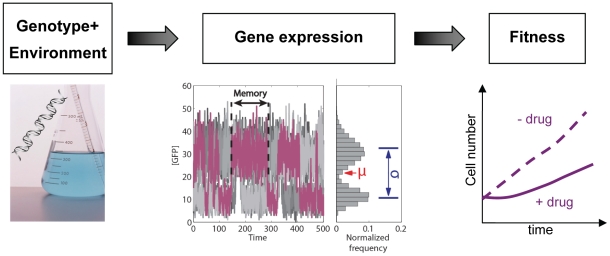
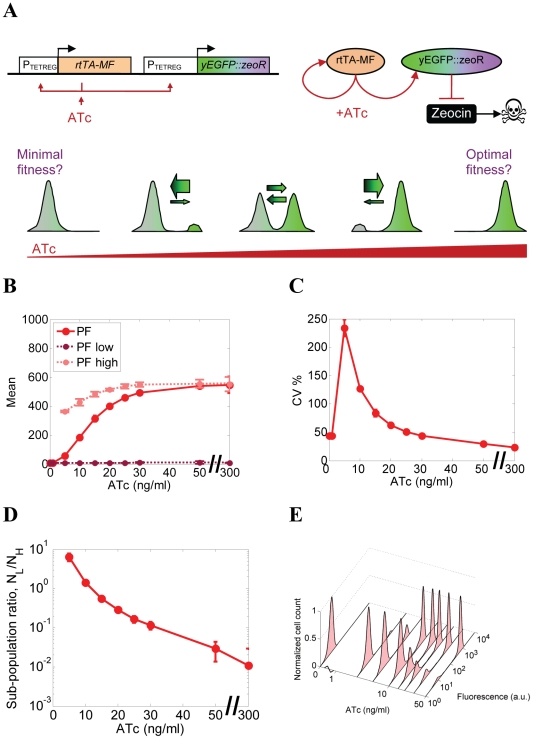
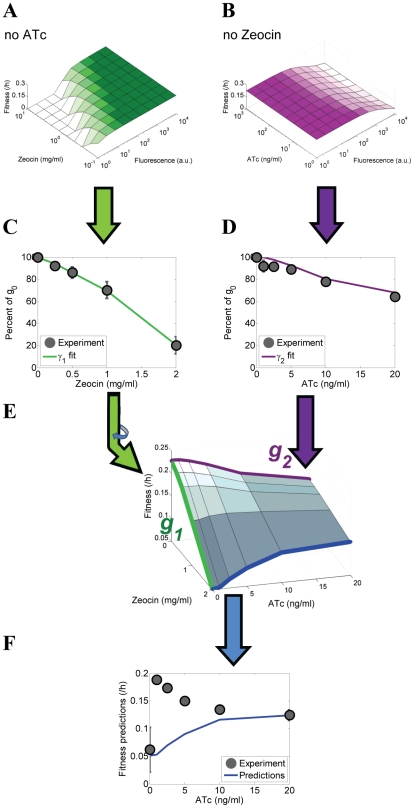
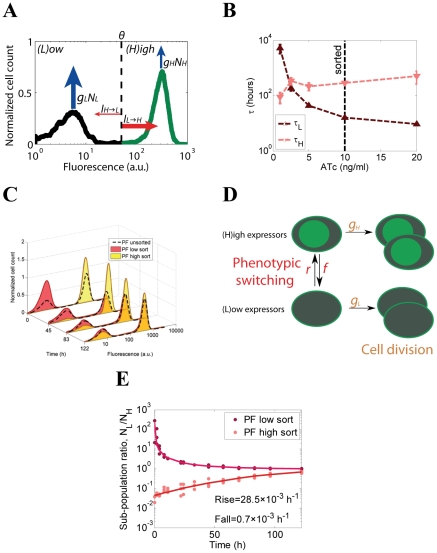
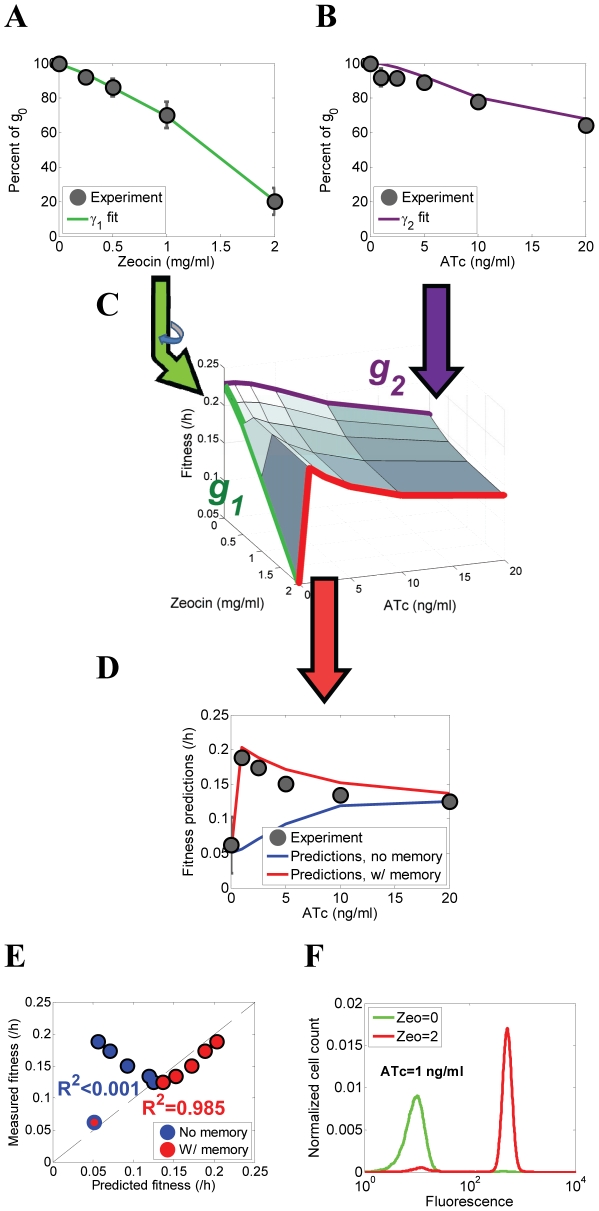
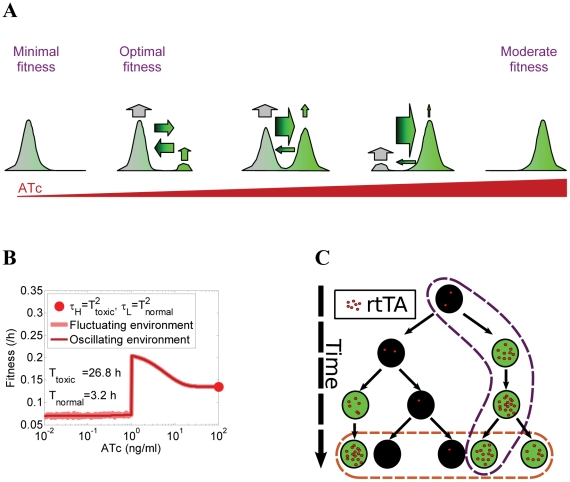
Gene expression actualizes the organismal phenotypes encoded within the genome in an environment-dependent manner. Among all encoded phenotypes, cell population growth rate (fitness) is perhaps the most important, since it determines how well-adapted a genotype is in various environments. Traditional biological measurement techniques have revealed the connection between the environment and fitness based on the gene expression mean. Yet, recently it became clear that cells with identical genomes exposed to the same environment can differ dramatically from the population average in their gene expression and division rate (individual fitness). For cell populations with bimodal gene expression, this difference is particularly pronounced, and may involve stochastic transitions between two cellular states that form distinct sub-populations. Currently it remains unclear how a cell population's growth rate and its subpopulation fractions emerge from the molecular-level kinetics of gene networks and the division rates of single cells. To address this question we developed and quantitatively characterized an inducible, bistable synthetic gene circuit controlling the expression of a bifunctional antibiotic resistance gene in Saccharomyces cerevisiae. Following fitness and fluorescence measurements in two distinct environments (inducer alone and antibiotic alone), we applied a computational approach to predict cell population fitness and subpopulation fractions in the combination of these environments based on stochastic cellular movement in gene expression space and fitness space. We found that knowing the fitness and nongenetic (cellular) memory associated with specific gene expression states were necessary for predicting the overall fitness of cell populations in combined environments. We validated these predictions experimentally and identified environmental conditions that defined a "sweet spot" of drug resistance. These findings may provide a roadmap for connecting the molecular-level kinetics of gene networks to cell population fitness in well-defined environments, and may have important implications for phenotypic variability of drug resistance in natural settings.


Conflict of interest statement

The authors have declared that no competing interests exist.

Figures

Figure 1
Figure 1. Gene expression connects genotype to phenotype.
Gene expression (middle panel) is a complex process that bridges the genotype (left panel) and fitness (right panel). Stochastic gene expression at any instant of time can be described by a distribution (gray bars). The distribution can be further characterized by its mean (red arrow; the arithmetic average taken over all cells), standard deviation (blue arrows; quantifies deviations from the mean), and possibly other moment-related metrics. Moreover, gene expression also has temporal aspects, which can be characterized by nongenetic (cellular) memory (horizontal black arrows; the average time for which cells maintain a specific expression state in a constant environment). Ten time course simulations of stochastic gene expression in bistable cell lineages are shown as illustration (gray traces).
Figure 2
Figure 2. Characterization of gene expression in cells bearing PF circuit.
(A) The positive feedback (PF) synthetic gene circuit and its functional schematic, consisting of the rtTA-MF transactivator that activates itself and the yEGFP::zeoR reporter when bound by the ATc inducer. Idealized plots of expected outputs illustrates that tuning the inducer concentration upward is expected to result in progressively higher fractions of yEGFP::zeoR-expressing ON cells (green peaks), which should correspond to increasing fitness during drug treatment. Another naïve expectation is that increasing fractions of ON cells correspond to higher cellular memory of ON cells relative to the OFF cells, such that equal memories (or switching rates, indicated by the arrows) correspond to equal fractions of ON and OFF cells. (B) Dose-response of the population average (mean) of yEGFP::ZeoR expression controlled by the PF gene circuit. Mean fluorescence values are shown for overall cell populations, as well as for low and high expressor subpopulations separately (dark and light red markers) where applicable, based on a custom bimodality detection algorithm (see Section 2 in Text S1). (C) Dose-response of the overall coefficient of variation (CV) of yEGFP::ZeoR expression for the PF gene circuit. (D) Dose-response of the subpopulation ratio R, defined as the number of low yEGFP::ZeoR-expressing cells divided by the number of high yEGFP::ZeoR-expressing cells. (E) Experimental fluorescence histograms of yEGFP::zeoR for the PF strains at increasing ATc concentrations (0–50 ng/mL).
Figure 3
Figure 3. Experimentally measured and predicted fitnesses of PF cells assuming fast switching at various combinations of ATc and Zeocin.
(A) Instantaneous fitness reduction γ 1 as a function of varying Zeocin concentrations and fluorescence at 0 ng/ml ATc. The antibiotic prolongs the cell cycle, thereby reducing the instantaneous fitness (which is the typical division rate of cells with a certain level of yEGFP::zeoR expression). (B) Instantaneous fitness reduction γ 2 as a function of varying inducer (ATc) concentrations and fluorescence (used as a proxy for rtTA concentrations) in the absence of antibiotic (0 mg/ml Zeocin). The cell cycle slows down due to the toxic effects of activated rtTA molecules, causing an instantaneous fitness cost as noise forces the cells to explore the potential landscape. (C) Overall population-level fitness reduction as a function of increasing Zeocin concentrations at 0 ng/ml ATc, reflecting the toxic effect of the antibiotic. (D) Overall population-level fitness reduction as a function of increasing ATc concentrations at 0 mg/ml Zeocin due to various costs related to inducer-bound rtTA. (E) Predicted overall population-level fitness landscape for PF cells as a function of various extracellular ATc and Zeocin concentrations. The fitness landscape is calculated by averaging the product of instantaneous fitness reductions γ 1(F,Z) and γ 2(F,C), shown in panels (A) and (B) weighted by the fluorescence distributions shown in Fig. 2E. (F) Measured and predicted overall fitness of PF cell populations at different concentrations of ATc and Zeocin = 2 mg/ml. Predictions based on the fitness landscape (blue) explained <0.1% of overall cell population fitness.
Figure 4
Figure 4. Cellular memory estimation and measurement based on the cellular current.
(A) Cellular currents characterize the constant upward and downward movement of cells within stationary distributions under the influence of noise. Cells were first partitioned into 2 gene expression states, of (L)ow and (H)igh yEGFP:zeoR expression, depending on how their fluorescence compared to a preset threshold θ. The upward cellular current (IL→H) was defined as the fraction of cells leaving the L gene expression state per unit time, while the downward cellular current IH→L described movement in the opposite direction. For stationary distributions where fitness is unaffected by particular expression state, the upward and downward cellular currents must cancel each other. On the other hand, unequal high and low expressor fitness values (gLgH) imply unequal cellular currents (ILIH), even in stationary distributions. (B) Cellular memories estimated from the gene expression distributions in Fig. 2E using the cellular current model, incorporating instantaneous cellular fitness differences. For example, cellular memory of the H state is the average time it takes for a H cell to cross the preset threshold downward. (C) Histograms of cells sorted into high and low yEGFP::zeoR expression states and maintained in 10 ng/ml ATc-containing medium over several days. Cell sorting occurred at time 0 after fluorescence distributions stabilized (did not change between subsequent measurements). Experimental fluorescence histograms of high-sorted and low-sorted cells relaxing back to the stationary distribution are shown for 122 hours. (D) Schematic of the two state population-dynamics model used to estimate switching rates. (E) Low to high expressor subpopulation ratio (R = NL/NH) after sorting PF cells into predominantly high and low expressor subpopulations. Experimental time course data (dots) of low-sorted and high-sorted subpopulations and the corresponding fits (lines) based on the two-state population dynamics model illustrate their relaxation back to their original bimodal distributions. The “rising” and “falling” rates were estimated from both low-sorted and high-sorted cell populations, revealing a higher gene expression memory for PF high expressors as compared to low expressors.
Figure 5
Figure 5. Experimentally measured and predicted fitness of PF cell populations after incorporating cellular memory at various combinations of ATc and Zeocin.
(A) Overall population-level fitness reduction as a function of increasing Zeocin concentrations at 0 ng/ml ATc, reflecting the toxic effect of the antibiotic. (B) Overall population-level fitness reduction as a function of increasing ATc concentrations at 0 mg/ml Zeocin due to various costs related to inducer-bound rtTA. (C) Predicted overall population-level fitness landscape for PF cells as a function of extracellular ATc and Zeocin. The fitness landscape is calculated from the 2-state cell model with division rates and switching rates inferred from cellular memory and the marginal fitness functions γ 1(F,Z) (green edge) and γ 2(F,C) (purple edge) shown in panels (A) and (B), respectively (D) Experimental measurements (black dots) and computational predictions either incorporating (red line) or omitting (blue line) cellular memory of overall fitness of PF cell populations at different concentrations of ATc and Zeocin = 2 mg/ml. The incorporation of cellular memory improves the agreement between the predictions and experiment. (E) Computational predictions based on the gene expression distributions assuming fast switching (blue circles) explained barely <0.1% of overall cell population fitness, while predictions based on fitness landscape and memory (red circles) explained 98.5% of overall cell population fitness. (F) Experimental yEGFP::ZeoR histograms at the “sweet spot” of drug resistance of 1 ng/ml ATc before selection (Zeocin = 0 mg/ml, green line) and after selection (Zeocin = 2 mg/ml, red line). Note the drastic difference between these two histograms with PF cells changing from almost 100% low expressors to nearly 100% high expressors following selection.
Figure 6
Figure 6. Memory and fitness define the gene expression distribution.
(A) The cellular memory and fitness of the cellular states interacted in multiple ways that ultimately defined the overall cell population fitness and the distribution of gene expression. Contrary to the naïve expectations illustrated in Figure 2A, we observed that (i) the fractions of cells in the ON and OFF states did not reflect the switching rates between these states; and (ii) forcing most cells into the protected ON state did not provide optimal fitness during drug treatment. (B) Simulated cell population fitness as a function of ATc when the environment switches either randomly or periodically between 0 mg/ml Zeocin (normal) and 2 mg/ml Zeocin (toxic), with the average duration of the normal and toxic environments indicated in the figure. The red circles indicate the ATc concentration (ATc = 100 ng/ml) necessary for setting the phenotypic switching rates to confer optimal fitness based on the Kussell-Leibler theory. (C) Illustration of how cell linage statistics (purple outline) can be different from population snapshot statistics (orange outline). Cells tend to switch predominantly to the high expression state and rarely switch back. Consequently, individual cell lineages over time tend to spend most of their time in the high expression state. However, cellular fitness in the high expression state is lower. As a result, population snapshot measurements will observe more low expressor cells due to the higher cellular fitness of the low-expressing state.

References

    1. Jacob F, Monod J. Genetic regulatory mechanisms in the synthesis of proteins. J Mol Biol. 1961;3:318–356. - PubMed
    1. Dekel E, Alon U. Optimality and evolutionary tuning of the expression level of a protein. Nature. 2005;436:588–592. - PubMed
    1. Dykhuizen DE, Dean AM, Hartl DL. Metabolic flux and fitness. Genetics. 1987;115:25–31. - PMC - PubMed
    1. Perfeito L, Ghozzi S, Berg J, Schnetz K, Lassig M. Nonlinear fitness landscape of a molecular pathway. PLoS Genet. 2011;7:e1002160. - PMC - PubMed
    1. Ferea TL, Botstein D, Brown PO, Rosenzweig RF. Systematic changes in gene expression patterns following adaptive evolution in yeast. Proc Natl Acad Sci U S A. 1999;96:9721–9726. - PMC - PubMed

Publication types

MeSH terms

Substances