

Diagnosis of pancreatic ductal adenocarcinoma and chronic pancreatitis by measurement of microRNA abundance in blood and tissue
- PMID: 22511932
- PMCID: PMC3325244
- DOI: 10.1371/journal.pone.0034151
Diagnosis of pancreatic ductal adenocarcinoma and chronic pancreatitis by measurement of microRNA abundance in blood and tissue
Abstract
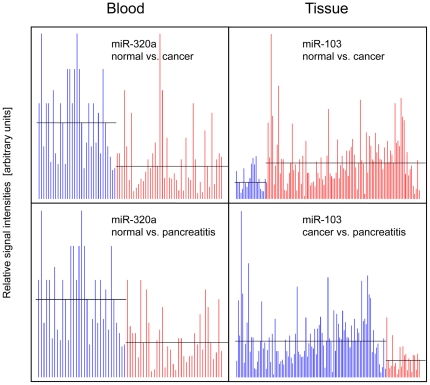
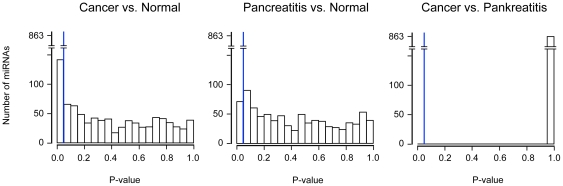
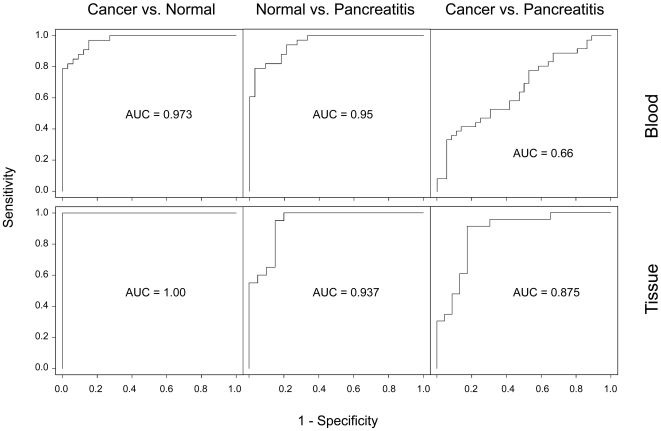
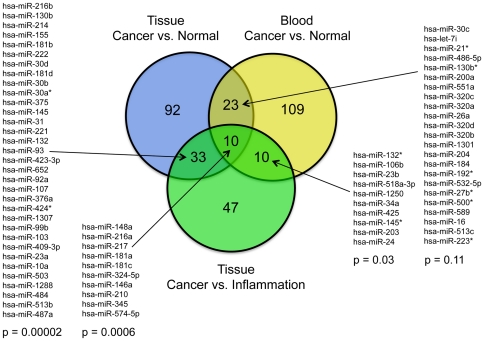
A solid process for diagnosis could have a substantial impact on the successful treatment of pancreatic cancer, for which currently mortality is nearly identical to incidence. Variations in the abundance of all microRNA molecules from peripheral blood cells and pancreas tissues were analyzed on microarrays and in part validated by real-time PCR assays. In total, 245 samples from two clinical centers were studied that were obtained from patients with pancreatic ductal adenocarcinoma or chronic pancreatitis and from healthy donors. Utilizing the minimally invasive blood test, receiver operating characteristic (ROC) curves and the corresponding area under the curve (AUC) analysis demonstrated very high sensitivity and specificity of a distinction between healthy people and patients with either cancer or chronic pancreatitis; respective AUC values of 0.973 and 0.950 were obtained. Confirmative and partly even more discriminative diagnosis could be performed on tissue samples with AUC values of 1.0 and 0.937, respectively. In addition, discrimination between cancer and chronic pancreatitis was achieved (AUC = 0.875). Also, several miRNAs were identified that exhibited abundance variations in both tissue and blood samples. The results could have an immediate diagnostic value for the evaluation of tumor reoccurrence in patients, who have undergone curative surgical resection, and for people with a familial risk of pancreatic cancer.
Conflict of interest statement
Figures
References
-
- Jemal A, Siegel R, Xu J, Ward E. Cancer statistics, 2010. CA Cancer J Clin. 2010;60:277–300. - PubMed
-
- Brandt R, Grützmann R, Bauer A, Jesnowski R, Ringel J, et al. DNA-microarray analysis of pancreatic malignancies. Pancreatology. 2004;4:587–597. - PubMed
-
- Bussom S, Saif MW. Methods and rationale for the early detection of pancreatic cancer. J Pancreas. 2010;11:128–130. - PubMed
Publication types
MeSH terms
Substances
LinkOut - more resources
Full Text Sources
Other Literature Sources
Molecular Biology Databases
