. 2012;7(4):e34451.
doi: 10.1371/journal.pone.0034451. Epub 2012 Apr 12.

Genome-wide DNA methylation scan in major depressive disorder

Collaborators, Affiliations

Genome-wide DNA methylation scan in major depressive disorder

Sarven Sabunciyan et al. PLoS One. 2012.

Abstract

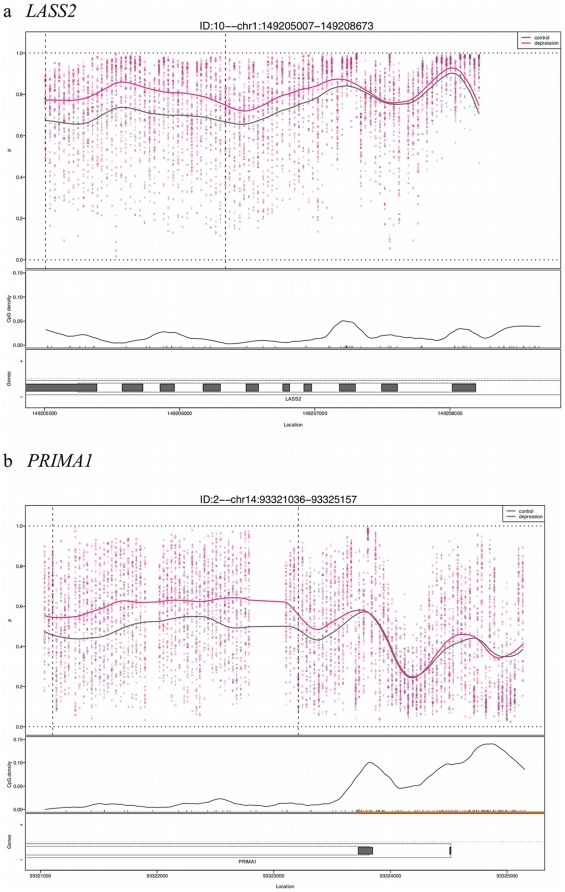
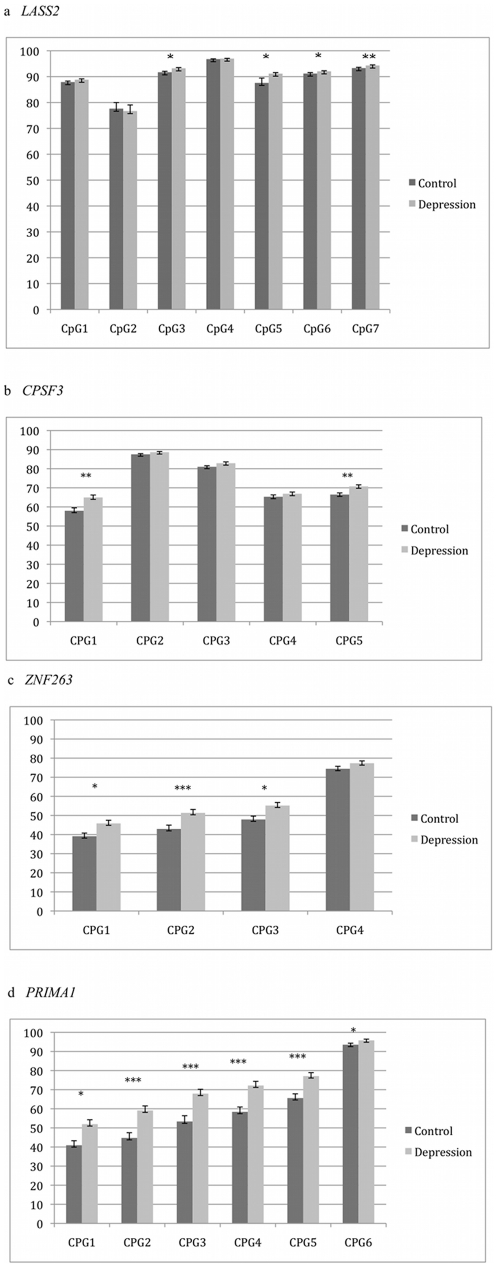
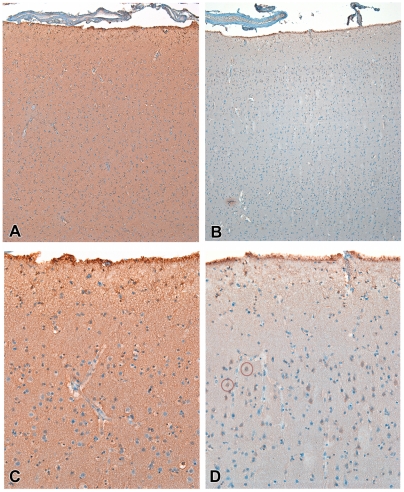
While genome-wide association studies are ongoing to identify sequence variation influencing susceptibility to major depressive disorder (MDD), epigenetic marks, such as DNA methylation, which can be influenced by environment, might also play a role. Here we present the first genome-wide DNA methylation (DNAm) scan in MDD. We compared 39 postmortem frontal cortex MDD samples to 26 controls. DNA was hybridized to our Comprehensive High-throughput Arrays for Relative Methylation (CHARM) platform, covering 3.5 million CpGs. CHARM identified 224 candidate regions with DNAm differences >10%. These regions are highly enriched for neuronal growth and development genes. Ten of 17 regions for which validation was attempted showed true DNAm differences; the greatest were in PRIMA1, with 12-15% increased DNAm in MDD (p = 0.0002-0.0003), and a concomitant decrease in gene expression. These results must be considered pilot data, however, as we could only test replication in a small number of additional brain samples (n = 16), which showed no significant difference in PRIMA1. Because PRIMA1 anchors acetylcholinesterase in neuronal membranes, decreased expression could result in decreased enzyme function and increased cholinergic transmission, consistent with a role in MDD. We observed decreased immunoreactivity for acetylcholinesterase in MDD brain with increased PRIMA1 DNAm, non-significant at p = 0.08.While we cannot draw firm conclusions about PRIMA1 DNAm in MDD, the involvement of neuronal development genes across the set showing differential methylation suggests a role for epigenetics in the illness. Further studies using limbic system brain regions might shed additional light on this role.


Conflict of interest statement

Competing Interests: The authors have declared that no competing interests exist.

Figures

Figure 1
Figure 1. Examples of CHARM results for two of the regions showing greatest DNAm differences between MDD cases and controls.
The plots show percent methylation versus genomic location with each point representing the methylation level of an individual sample for a given probe. The curve represents averaged smoothed percent methylation values. The locations of CpG dinucleotides are indicated with black tickmarks on the X-axis. CpG density was calculated across the region using a standard density estimator and is represented by the smoothed black line. The location of the CpG island is denoted on the X-axis as an orange line. Gene annotation is indicated, showing LASS2 in (a) and PRIMA1 in (b). The thin outer grey line represents the transcript, while the thin inner lines represent a coding region. Filled in grey boxes represent exons.
Figure 2
Figure 2. Results of bisulfite pyrosequencing for validation of CHARM in brain samples.
Regions in or near four genes showed differences that remained statistically significant after correction for having tested 17 genes: (a) LASS2, (b) CPSF3, (c) ZNF263, (d) PRIMA1. The grey bars represent values from control brain sample DNA, while the black bars represent those from MDD brain samples. The Y-axis is percent DNA methylation, while the X-axis shows distance along the chromosome for each CpG dinucleotide assayed. One asterisk indicates a difference between MDD and control of p<0.05. Two asterisks indicates p<0.0029 (a correction for 17 regions tested). Three asterisks indicates p<0.00054 (a correction for 92 CpGs tested).
Figure 3
Figure 3. Immunohistochemical pattern of AChE in frontal cortex.
(A) In controls there is diffuse and intense pattern of immunoreactivity involving mainly the neuropil. (B) In MDD subjects, though variable, immunostaining was reduced. Both 200×. (C) In controls, there is virtually no perikaryal staining. (D) The latter contrasts with the pattern observed in some areas in MDD subjects, in which groups of pyramidal neurons display intense perikaryal staining, suggesting redistribution of the enzyme to the cell body. The red circles highlight examples. Both 640×.

References

    1. Sullivan PF, Neale MC, Kendler KS. Genetic epidemiology of major depression: Review and meta-analysis. Am J Psychiatry. 2000;157:1552–1562. - PubMed
    1. Shyn SI, Shi J, Kraft JB, Potash JB, Knowles JA, et al. Novel loci for major depression identified by genome-wide association study of sequenced treatment alternatives to relieve depression and meta-analysis of three studies. Mol Psychiatry. 2011;16:202–15. - PMC - PubMed
    1. Paykel ES, Myers JK, Dienelt MN, Klerman GL, Lindenthal JJ, et al. Life events and depression. A controlled study. Arch Gen Psychiatry. 1969;21:753–760. - PubMed
    1. Weaver IC, Cervoni N, Champagne FA, D'Alessio AC, Sharma S, et al. Epigenetic programming by maternal behavior. Nat Neurosci. 2004;7:847–54. - PubMed
    1. McGowan PO, Sasaki A, D'Alessio AC, Dymov S, Labonte B, et al. Epigenetic regulation of the glucocorticoid receptor in human brain associates with childhood abuse. Nat Neurosci. 2009;12:342–348. - PMC - PubMed

Publication types