

Consumer preferences for hearing aid attributes: a comparison of rating and conjoint analysis methods
- PMID: 22514094
- PMCID: PMC4040849
- DOI: 10.1177/1084713811434617
Consumer preferences for hearing aid attributes: a comparison of rating and conjoint analysis methods
Abstract
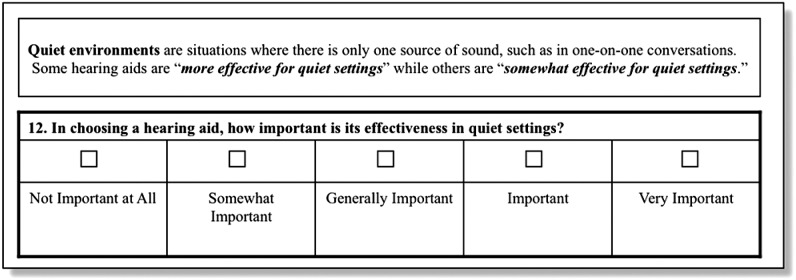
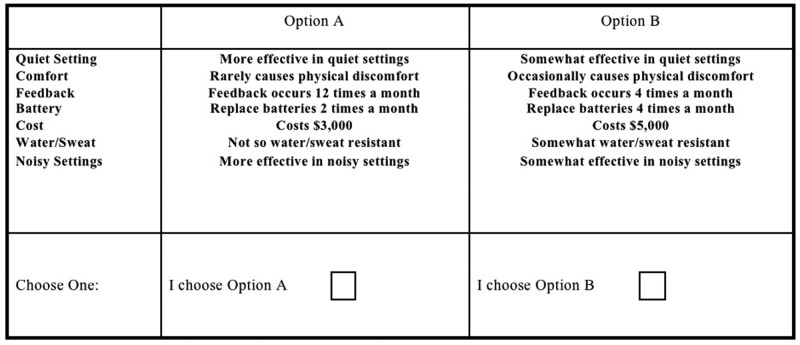
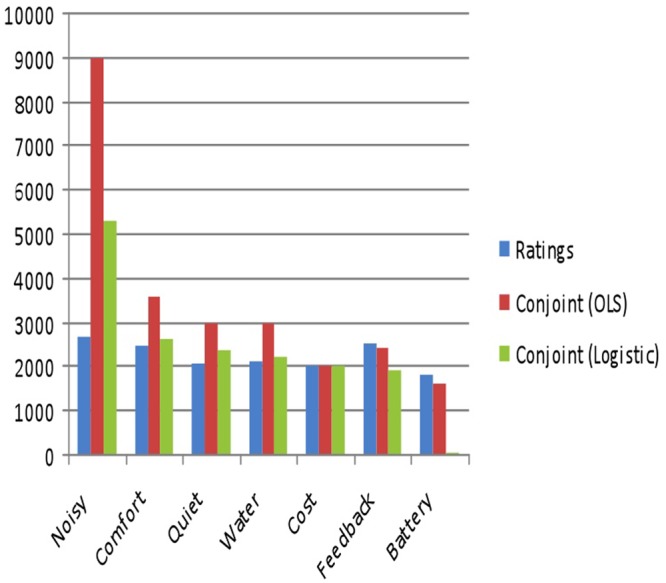
Low utilization of hearing aids has drawn increased attention to the study of consumer preferences using both simple ratings (e.g., Likert scale) and conjoint analyses, but these two approaches often produce inconsistent results. The study aims to directly compare Likert scales and conjoint analysis in identifying important attributes associated with hearing aids among those with hearing loss. Seven attributes of hearing aids were identified through qualitative research: performance in quiet settings, comfort, feedback, frequency of battery replacement, purchase price, water and sweat resistance, and performance in noisy settings. The preferences of 75 outpatients with hearing loss were measured with both a 5-point Likert scale and with 8 paired-comparison conjoint tasks (the latter being analyzed using OLS [ordinary least squares] and logistic regression). Results were compared by examining implied willingness-to-pay and Pearson's Rho. A total of 56 respondents (75%) provided complete responses. Two thirds of respondents were male, most had sensorineural hearing loss, and most were older than 50; 44% of respondents had never used a hearing aid. Both methods identified improved performance in noisy settings as the most valued attribute. Respondents were twice as likely to buy a hearing aid with better functionality in noisy environments (p < .001), and willingness to pay for this attribute ranged from US$2674 on the Likert to US$9000 in the conjoint analysis. The authors find a high level of concordance between the methods-a result that is in stark contrast with previous research. The authors conclude that their result stems from constraining the levels on the Likert scale.
Conflict of interest statement
Figures
References
-
- Abrams E. T., Barnet J. M., Hoth A., Schultz S., Kaboli P. J. (2006). The relationship between hearing impairment and depression in older veterans. Journal of the American Geriatrics Society, 54, 1475-1477 - PubMed
-
- Abrams H., Chisolm T. H., McArdle R. (2002). A cost-utility analysis of adult group audiologic rehabilitation: Are the benefits worth the cost? Journal of Rehabilitation Research and Development, 39, 549-558 - PubMed
-
- Agrawal Y., Platz E. A., Niparko. J. K. (2008). Prevalence of hearing loss and differences by demographic characteristics among US adults: Data from the National Health and Nutrition Examination Survey, 1999-2004. Archives of Internal Medicine, 168, 1522-1530 - PubMed
-
- Akkazieva B., Gulacsi L., Brandtmuller A., Pentekk M., Bridges J. (2006). Patients’ preferences for health care system reform in Hungary: A conjoint analysis study. Applied Health Economics and Health Policy, 5, 189-198 - PubMed
-
- Arehart K. H., Kates J. M., Anderson M. C. (2010). Effects of noise, nonlinear processing, and linear filtering on perceived speech quality. Ear & Hearing, 31, 420-436 - PubMed
Publication types
MeSH terms
LinkOut - more resources
Full Text Sources
Medical