. 2012 Jun 8;287(24):19827-40.
doi: 10.1074/jbc.M112.347831. Epub 2012 Apr 18.

Cooperation of nuclear fibroblast growth factor receptor 1 and Nurr1 offers new interactive mechanism in postmitotic development of mesencephalic dopaminergic neurons

Affiliations

Cooperation of nuclear fibroblast growth factor receptor 1 and Nurr1 offers new interactive mechanism in postmitotic development of mesencephalic dopaminergic neurons

Olga Baron et al. J Biol Chem. .

Abstract

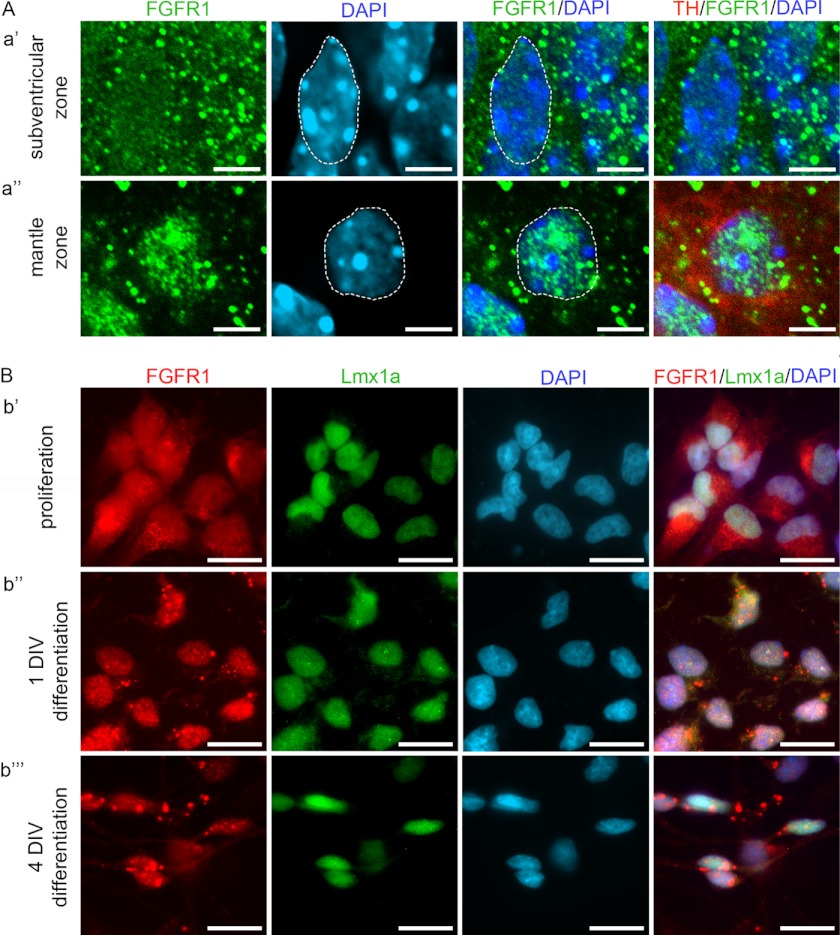
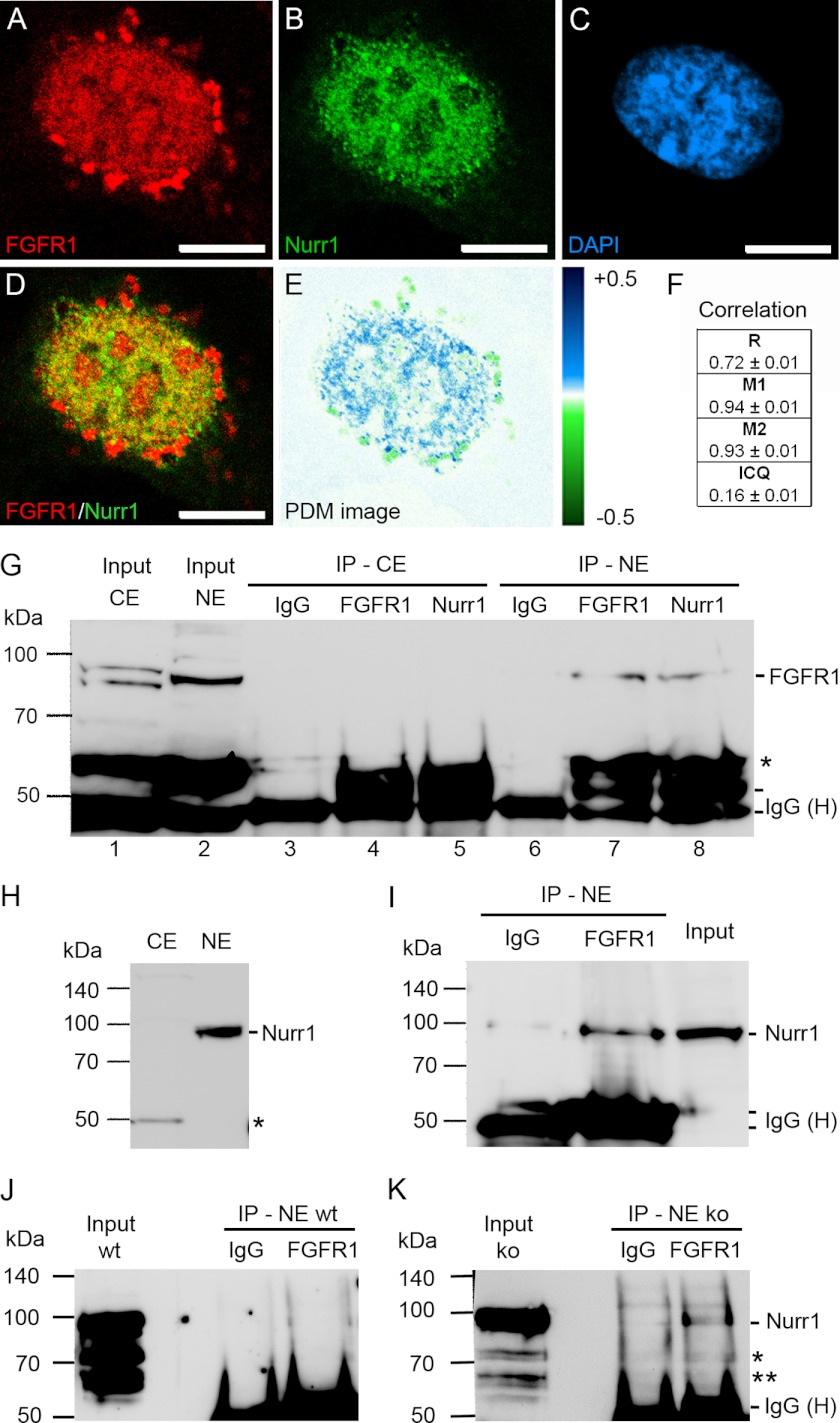
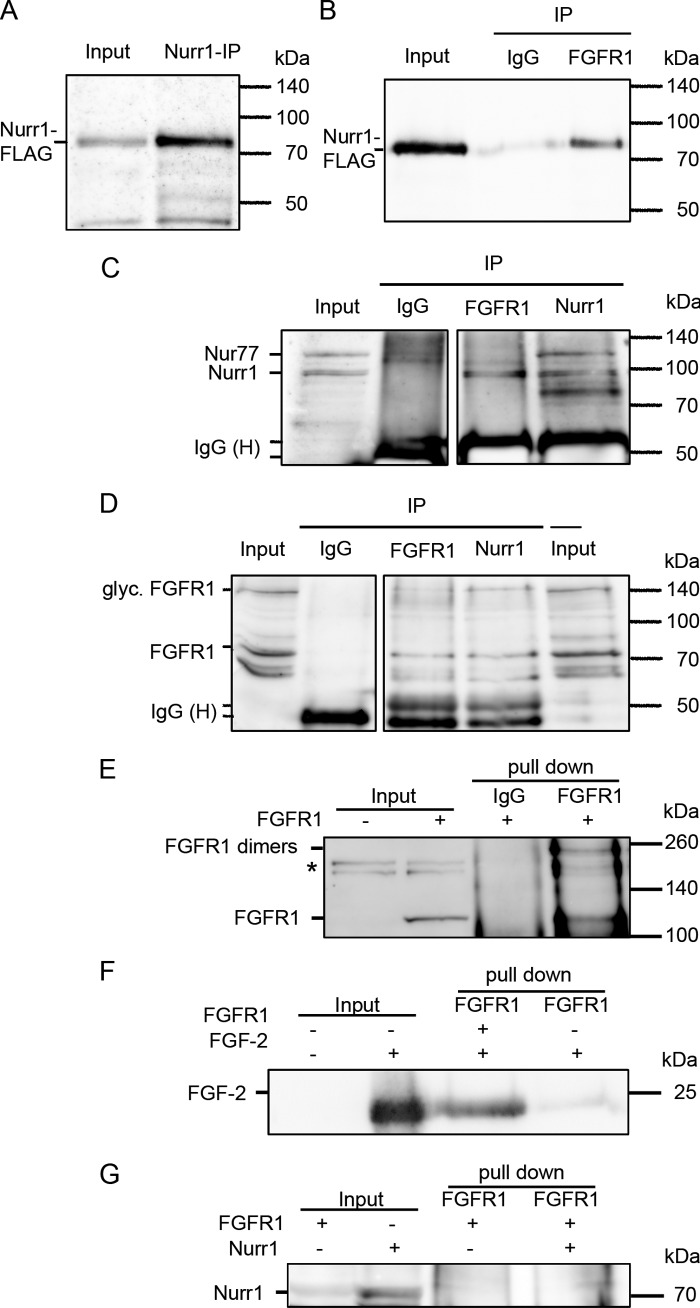
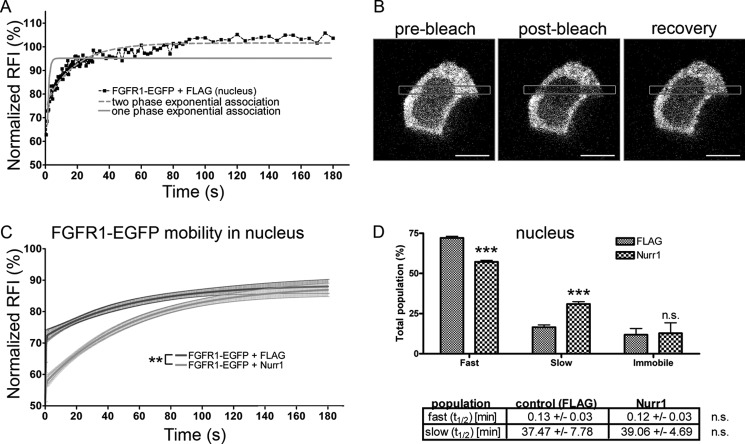
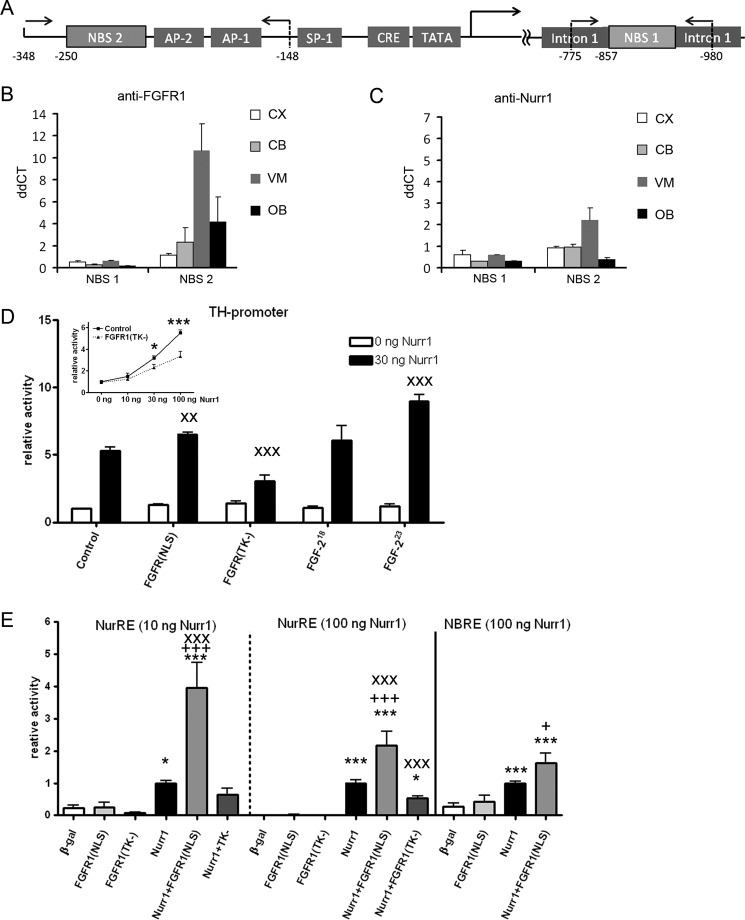
Experiments in mice deficient for Nurr1 or expressing the dominant-negative FGF receptor (FGFR) identified orphan nuclear receptor Nurr1 and FGFR1 as essential factors in development of mesencephalic dopaminergic (mDA) neurons. FGFR1 affects brain cell development by two distinct mechanisms. Activation of cell surface FGFR1 by secreted FGFs stimulates proliferation of neural progenitor cells, whereas direct integrative nuclear FGFR1 signaling (INFS) is associated with an exit from the cell cycle and neuronal differentiation. Both Nurr1 and INFS activate expression of neuronal genes, such as tyrosine hydroxylase (TH), which is the rate-limiting enzyme in dopamine synthesis. Here, we show that nuclear FGFR1 and Nurr1 are expressed in the nuclei of developing TH-positive cells in the embryonic ventral midbrain. Both nuclear receptors were effectively co-immunoprecipitated from the ventral midbrain of FGF-2-deficient embryonic mice, which previously showed an increase of mDA neurons and enhanced nuclear FGFR1 accumulation. Immunoprecipitation and co-localization experiments showed the presence of Nurr1 and FGFR1 in common nuclear protein complexes. Fluorescence recovery after photobleaching and chromatin immunoprecipitation experiments demonstrated the Nurr1-mediated shift of nuclear FGFR1-EGFP mobility toward a transcriptionally active population and that both Nurr1 and FGFR1 bind to a common region in the TH gene promoter. Furthermore, nuclear FGFR1 or its 23-kDa FGF-2 ligand (FGF-2(23)) enhances Nurr1-dependent activation of the TH gene promoter. Transcriptional cooperation of FGFR1 with Nurr1 was confirmed on isolated Nurr1-binding elements. The proposed INFS/Nurr1 nuclear partnership provides a novel mechanism for TH gene regulation in mDA neurons and a potential therapeutic target in neurodevelopmental and neurodegenerative disorders.


Figures

FIGURE 1.
FIGURE 1.
Nurr1 and FGFR1 expression in the ventral midbrain of E14.5 embryos. A–H, Nurr1 is expressed in postmitotic dopaminergic precursors of subventricular (svz) and TH-expressing dopaminergic neurons of the mantle zone (mz) in wild-type (wt, A and B; scale bar, 200 μm) and FGF-2-deficient (ko, E and F: scale bar, 200 μm) animals, but not in the proliferative progenitors in the ventricular zone (vz). Higher magnification epifluorescence images of Nurr1/TH co-labeling (C, D, G, and H; scale bar, 10 μm) in the region outlined in F show Nurr1 (B) expression in the DAPI stained nucleus. I–P, FGFR1 was abundantly expressed in the VM of WT (I–L; scale bar, 200 μm) and knockout (ko, M–P; scale bar, 200 μm) embryos including the TH-positive mDA domain (J and N). Higher magnification confocal images of FGFR1/TH co-labeling in the regions outlined in J and N show FGFR1 expression in the nucleus (DAPI, blue) of the TH-positive cells located in the mantle zone in WT (K and L; scale bar, 5 μm) and knockout (ko, O and P; scale bar, 5 μm).
FIGURE 2.
FIGURE 2.
Nuclear accumulation of FGFR1 during differentiation of VM cells. A, confocal microscope images showing subcellular localization of FGFR1 in cells of the mDA field in VM of E14.5 mouse embryos. In the subventricular zone (panel a′), where undifferentiated cells are located, FGFR1 (green) showed a nearly uniform distribution in the cytoplasm and nucleus (blue, dotted line). In the mantle zone (panel a″), FGFR1 (green) shows a prominent accumulation in the nuclear (blue, dotted line) proportion of the differentiated neurons expressing TH (red). Scale bar, 5 μm. B, epifluorescence microscope images showing the accumulation of FGFR1 during differentiation of primary neuronal cultures of rat ventral mesencephalic progenitor cells. During proliferation (panel b′) FGFR1 (red) was localized in the cytoplasm and nucleus (DAPI, blue) of Lmx1a-positive (green) progenitor cells. After differentiation for 1 DIV (panel b″), FGFR1 showed a mainly nuclear distribution in Lmx1a-positive cells. After 4 DIV in differentiation medium (b⁗), FGFR1 was accumulated in the nucleus and also present in the neurites of the neuron like-shaped cells expressing Lmx1a. Scale bar, 10 μm.
FIGURE 3.
FIGURE 3.
Presence of FGFR1 and Nurr1 in the same nuclear protein complexes of ventral midbrain NPCs. A–F, co-localization analysis of SV40-VM-NPCs cultivated for 24 h in serum-free N2 medium. Confocal images showed granular distribution of FGFR1 (A, red) and Nurr1 (B, green) in the DAPI-stained nucleus (C, blue) of mDA progenitors. FGFR1 and Nurr1 showed co-localization in the nucleus as demonstrated in overlap (D) and PDM images (E, lut; blue, positive PDM and green negative PDM). F, co-localization analysis values with R, Mander's overlap coefficient (red:green pixel ratio = 1.00 ± 0.03); M1, Mander's co-localization coefficient for FGFR1; M2, Mander's co-localization coefficient for Nurr1; and ICQ. Scale bar, 5 μm. G–K, the IP with IgGs represented the negative control for co-precipitation. The input represented the loading control of 100 μg of pure denaturized nuclear protein extract free of denaturized IgG heavy chains (IgG (H)), which are present in IP lanes. Distinct nuclear (NE) ∼90-kDa and cytoplasmic (CE) ∼85- and ∼95-kDa bands of FGFR1 represented different glucosylation forms of the receptor and demonstrated the lack of cross-contamination between fractions (G, lane 1; *, truncated form of FGFR1). The precipitation with anti-Nurr1 resulted in co-precipitation of FGFR1 in the nuclear fraction (G, lane 8). Precipitation of nuclear FGFR1 with anti-FGFR1 is shown as a positive control (G, lane 7). The ∼90-kDa Nurr1 band may result because of post-transcriptional sumoylation of Nurr1 (59) and was present in the nuclear fraction but absent in the cytoplasmic fraction as determined by Western blot assay (H; *, antibody may recognize an additional splice isoform of Nurr1 (17)). Therefore precipitation was performed only in the nuclear fraction, which resulted in co-precipitation of Nurr1 with FGFR1 antibody (I). Precipitation of nuclear FGFR1 in lysates of VM from E14.5 FGF-2 knock out embryos resulted in co-precipitation of Nurr1 (K), whereas in IPs of VM lysates from E14.5 wild-type embryos, the signal was not clearly detectible (J; * and **, unmodified and/or splice forms of Nurr1). The amount of used material was limited by the availability of fresh tissue.
FIGURE 4.
FIGURE 4.
Nuclear FGFR1 and Nurr1 interaction after overexpression in human neuroblastoma cells. The human neuroblastoma cells were transfected with plasmids encoding for full-length FGFR1 protein, as well as Nurr1-protein fused to a 3×FLAG tag. 24 h after transfection, the cells were supplemented with 1 μm retinoic acid for a further 24 h. A–D, the nuclear extracts were immunoprecipitated with polyclonal anti-Nurr1, anti-FGFR1, and rabbit IgGs as negative control. Input represents 25 μg (A and C) and 100 μg (B and C), respectively, protein of the not precipitated nuclear extract. The additional band in C (compare Fig. 3K) may represent the closely related Nur77, which shows only a faint expression in VM (47). Precipitation with polyclonal Nurr1 and FGFR1 antibodies functioned properly as shown by detection of precipitated Nurr1 with the anti-FLAG antibody (A) and of precipitated FGFR1 with monoclonal anti-FGFR1 (mAb6) antibody (D), respectively. The FGFR1-IP resulted in co-precipitation of Nurr1 as recognized by anti-FLAG-tag antibody (B), as well as with anti-Nurr1 antibody (C, represents one blot). Correspondingly, the ∼85-kDa form of FGFR1 was able to co-precipitate with Nurr1, as detected by monoclonal anti-FGFR1 (mAb6) antibody (D, represents one blot). The negative controls, precipitated with rabbit IgGs, were missing the specific bands, confirming a specificity of the Nurr1 and FGFR1 immunoprecipitations. E, in vitro coupled transcription/translation of FGFR1 resulted in positive product at ∼120 kDa (input), which was missing in the control translation reaction without DNA template. The subsequent pull-down of FGFR1 with anti-FGFR1 antibody resulted in positive precipitates at ∼120 and ∼250 kDa, which would correspond to FGFR1 dimers. *, unspecific cross-reaction only observed in reticulocyte extracts. F, the positive interaction of FGF-2 was confirmed by subsequent pull-down along with FGFR1. G, the interaction of Nurr1 and FGFR1 seems to be indirect, because the subsequent pull-downs of Nurr1 and FGFR1 were negative.
FIGURE 5.
FIGURE 5.
FRAP of nuclear and cytoplasmic FGFR1-EGFP in neuroblastoma cells after co-transfection with Nurr1. A, one (gray line) and two exponential (gray dotted line) regression curves for data from one exemplary FRAP measurement in the nucleus of neuroblastoma cells transfected with FGFR1-EGFP. The regression analysis of recovery kinetics showed the best fit with a two exponential function. B, example of a single cell before and after photobleaching. Scale bar, 10 μm. C, after fitting two-exponential curves to FGFR1-EGFP, the recovery kinetics were significantly changed in the nucleus of neuroblastoma cells co-transfected with Nurr1–3×FLAG (n = 10). D, a significant shift of FGFR1-EGFP mobility was represented by a significant) decrease of the fast and a significant increase of the slow population in the nucleus of cells co-expressing Nurr1–3×FLAG compared with control cells co-expressing 3×FLAG. ***, p < 0.001. Recovery half-time (t½) values were not significantly altered (n.s., nonsignificant).
FIGURE 6.
FIGURE 6.
Nurr1 and FGFR1 bind to and cooperatively activate transcription from TH promoter. A, schematic of the TH gene promoter region. Binding sites for other factors are labeled accordingly. Arrows with numbers indicate positions of primers for ChIP. B and C, ChIP was performed with a panel of antibodies against FGFR1, Nurr1, and control IgG with subsequent quantitative PCR analyses of selected potential NBS on TH. IgG was used as a negative control. Graphs show ΔΔCt means ± S.E. of triplicate samples. CX, cortex; CB, cerebellum; VM, ventral midbrain (containing substantia nigra region); OB, olfactory bulb. D, co-transfection of human neuroblastoma cells with Nurr1–3×FLAG showed a dose-dependent increase of TH promoter-dependent luciferase reporter gene expression. The Nurr1-mediated TH promoter activity was significantly diminished by co-transfection of the dominant-negative form of FGFR1 lacking the tyrosine kinase activity [FGFR1(TK−)] starting at 30 ng of Nurr1-FLAG (inset). Co-transfection of FGFR1(NLS), FGFR1(TK−), as well as FGF-223 with Nurr1-FLAG, resulted in significant interaction altering Nurr1-dependent TH promoter activation. The noninteracting isoform FGF-218 did not influence TH promoter activity mediated by Nurr1. Two-way ANOVA on interaction with Nurr1: x, p < 0.05; xx, p < 0.01; xxx, p < 0.001. E, co-transfection of FGFR1(NLS) in neuroblastoma cells enhances Nurr1-NurRE and -NBRE-dependent luciferase transcription. The dose-dependent effects of NurRE activation by 10 and 100 ng of co-transfected Nurr1-FLAG are significantly potentiated by FGFR1(NLS), whereas the co-transfection of FGFR1(TK−) significantly inhibits 100 ng of Nurr1-NuRE activation. Co-transfection of FGFR1(NLS) also enhances Nurr1-dependent transcription from NBRE motive. One-way ANOVA significance to β-galactosidase (β-gal) is expressed as * and to Nurr1 as +. Two-way ANOVA displays Nurr1 interactions as x. Significance levels: *, p < 0.05; **, p < 0.01; ***, p < 0.001.

References

    1. Prakash N., Wurst W. (2006) Development of dopaminergic neurons in the mammalian brain. Cell Mol. Life Sci. 63, 187–206 - PMC - PubMed
    1. Nakamura S., Ito Y., Shirasaki R., Murakami F. (2000) Local directional cues control growth polarity of dopaminergic axons along the rostrocaudal axis. J. Neurosci. 20, 4112–4119 - PMC - PubMed
    1. Klejbor I., Myers J. M., Hausknecht K., Corso T. D., Gambino A. S., Morys J., Maher P. A., Hard R., Richards J., Stachowiak E. K., Stachowiak M. K. (2006) Fibroblast growth factor receptor signaling affects development and function of dopamine neurons. Inhibition results in a schizophrenia-like syndrome in transgenic mice. J. Neurochem. 97, 1243–1258 - PubMed
    1. Smidt M. P., Burbach J. P. (2009) Terminal differentiation ofmesodiencephalic dopaminergic neurons. The role of Nurr1 and Pitx3. Adv. Exp. Med. Biol. 651, 47–57 - PubMed
    1. Law S. W., Conneely O. M., DeMayo F. J., O'Malley B. W. (1992) Identification of a new brain-specific transcription factor, NURR1. Mol. Endocrinol. 6, 2129–2135 - PubMed

Publication types

MeSH terms

Substances

LinkOut - more resources