. 2012 Apr 18;32(16):5486-99.
doi: 10.1523/JNEUROSCI.0718-12.2012.

Regulation of NMDA receptor transport: a KIF17-cargo binding/releasing underlies synaptic plasticity and memory in vivo

Affiliations

Regulation of NMDA receptor transport: a KIF17-cargo binding/releasing underlies synaptic plasticity and memory in vivo

Xiling Yin et al. J Neurosci. .

Abstract

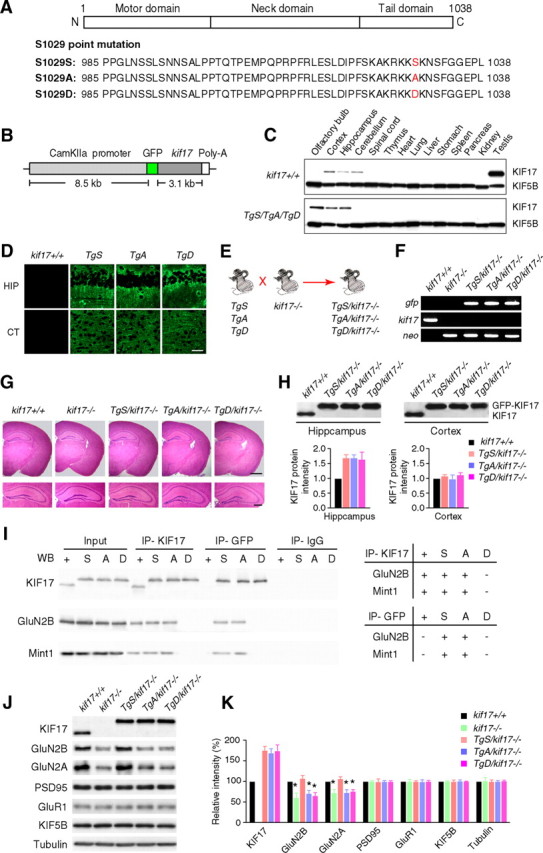
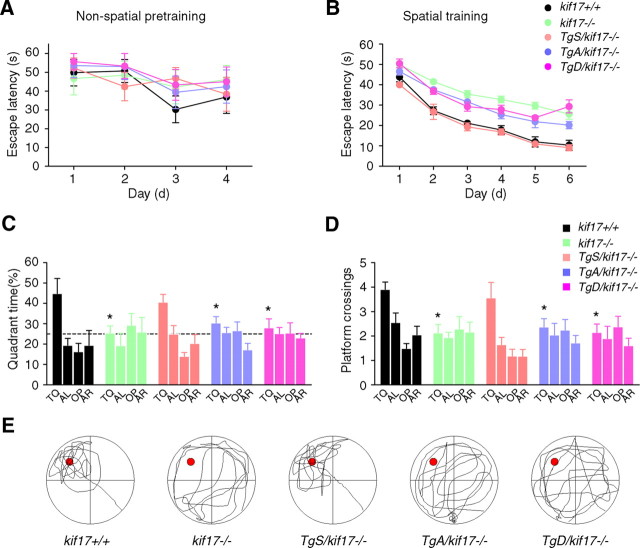
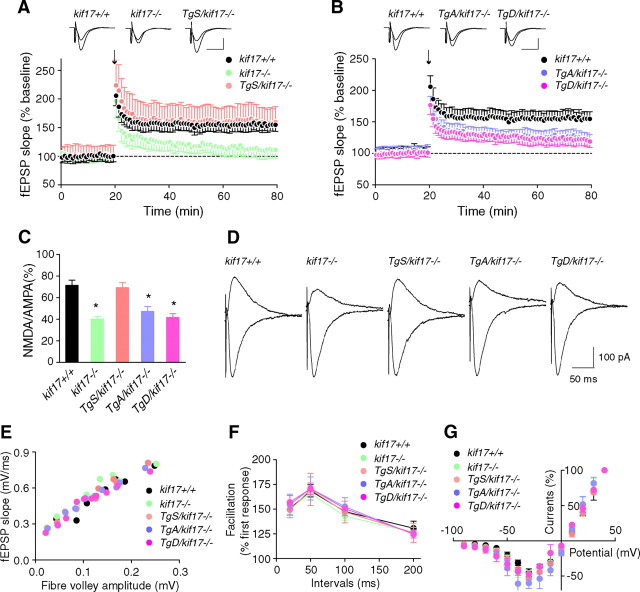
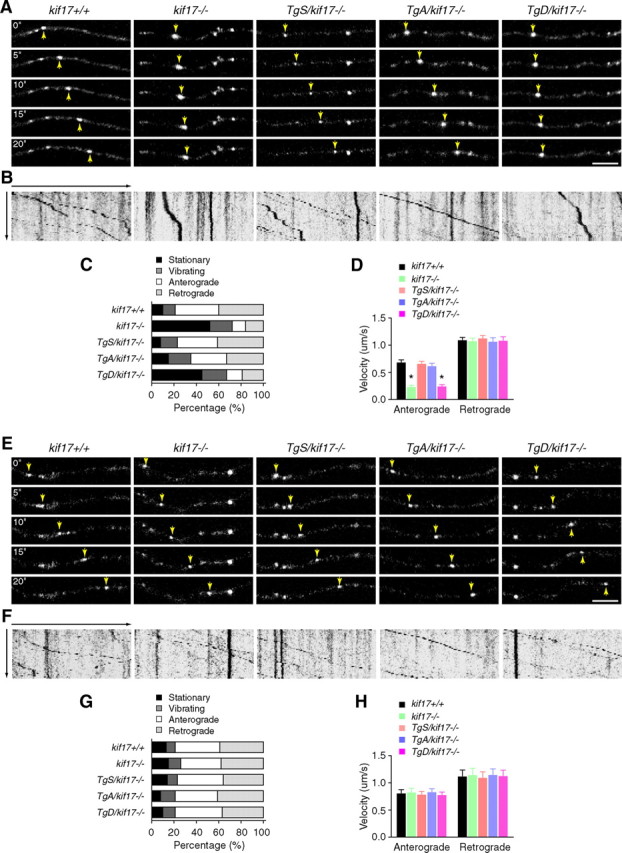
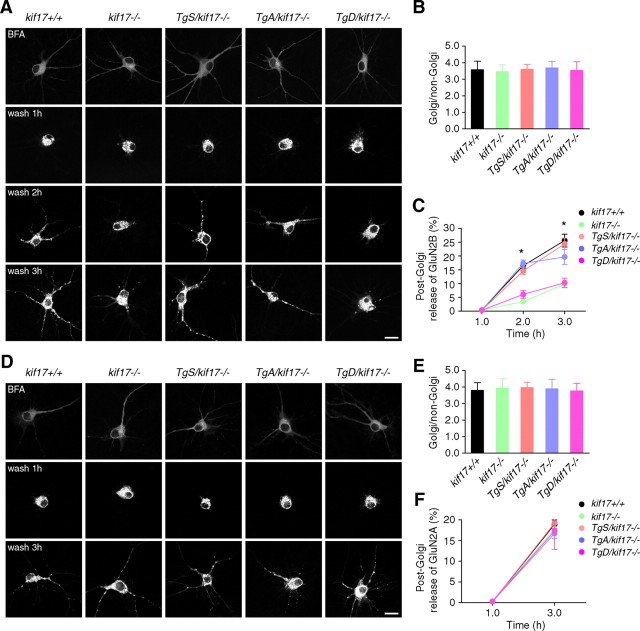
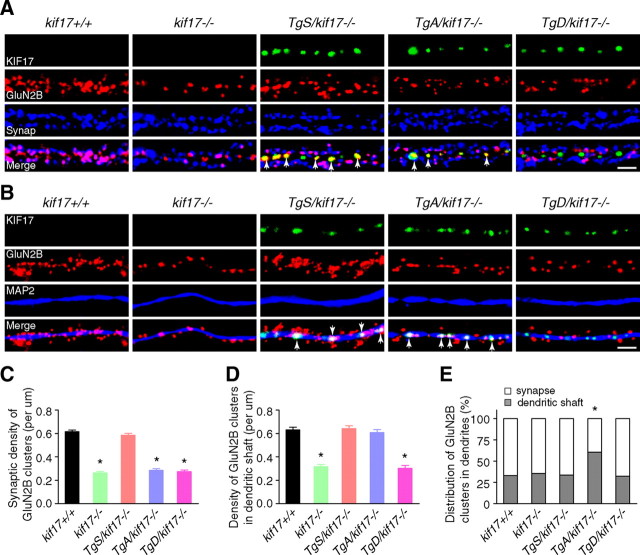
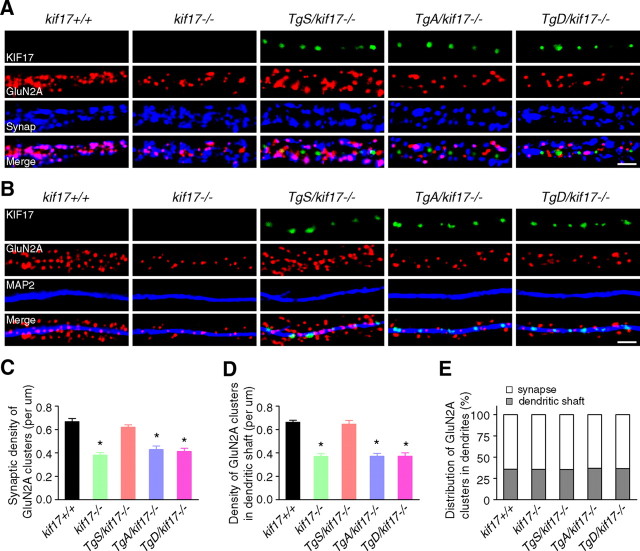
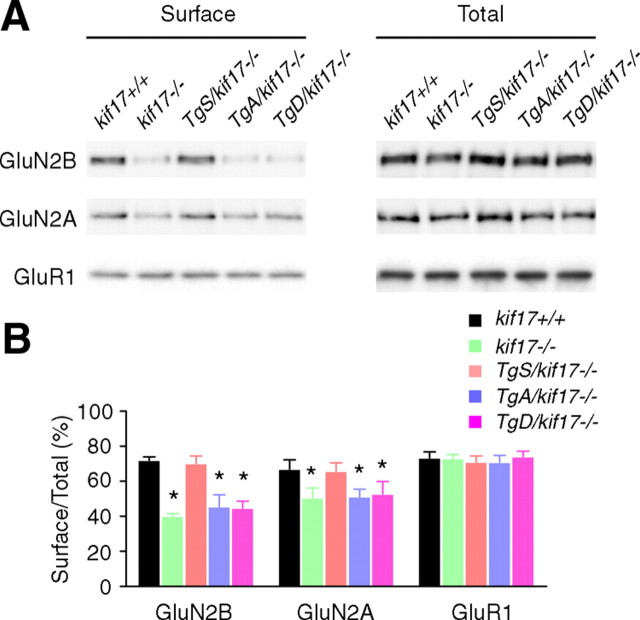
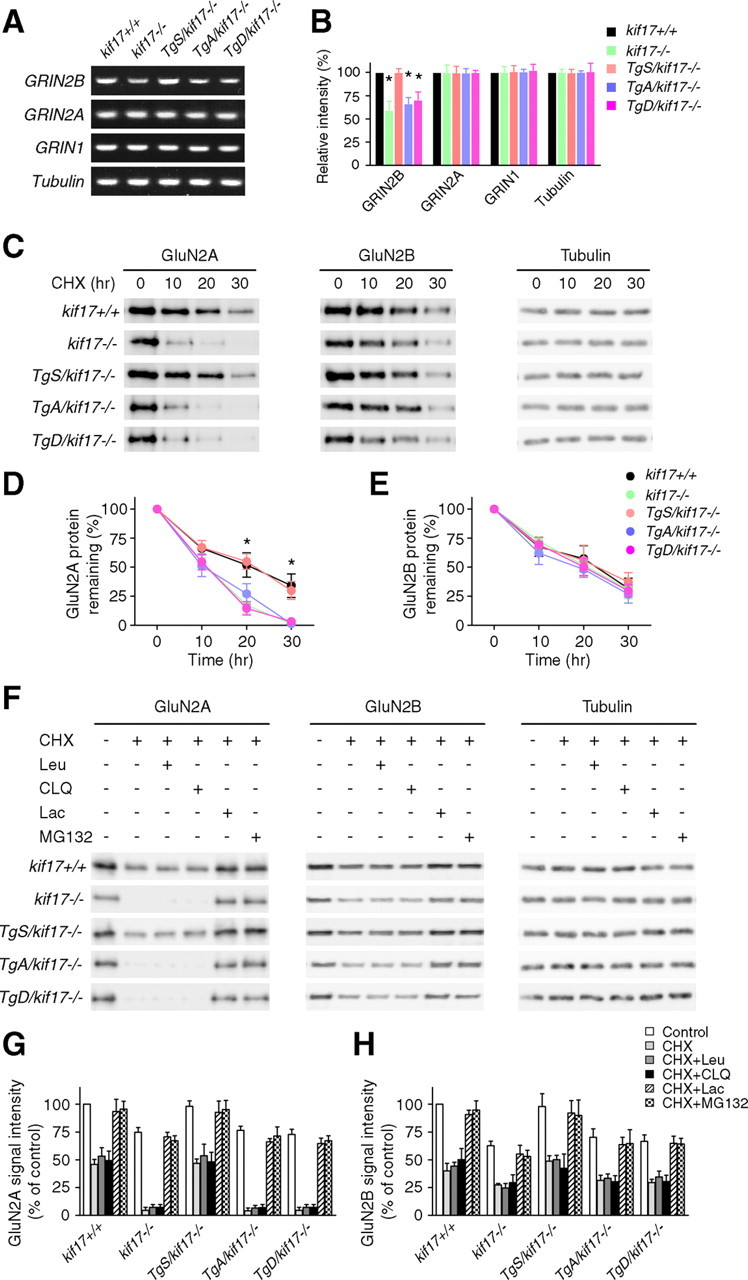
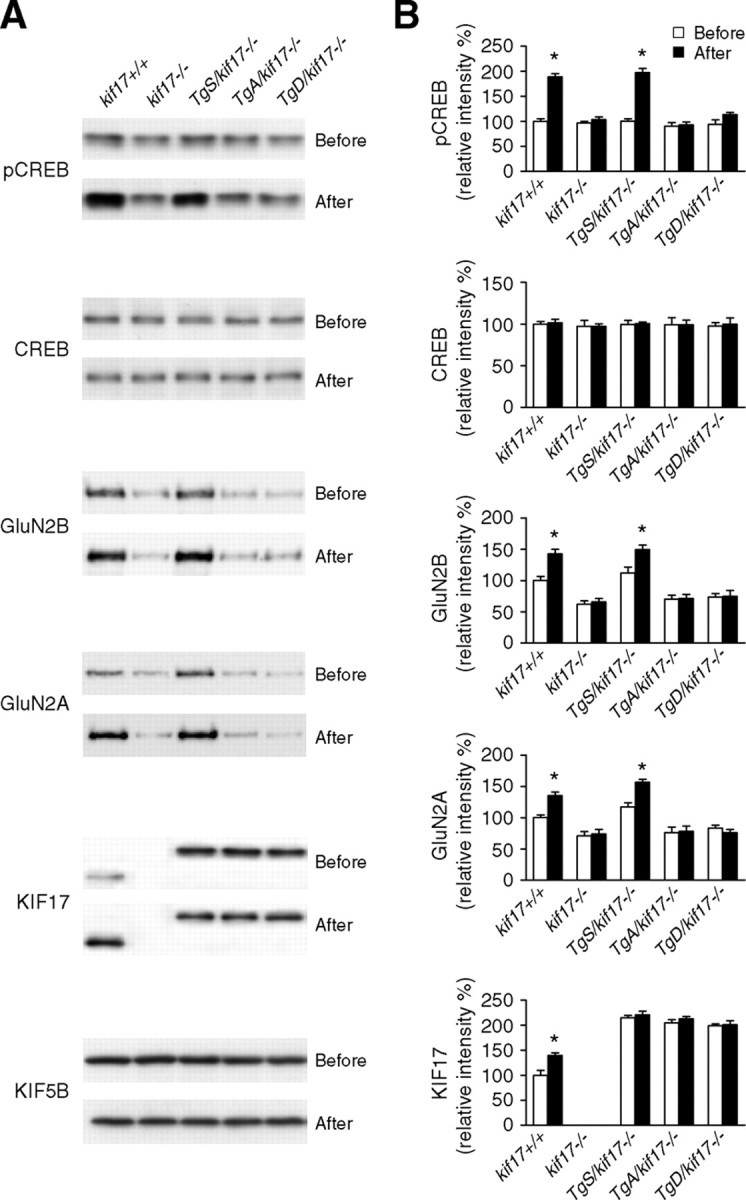
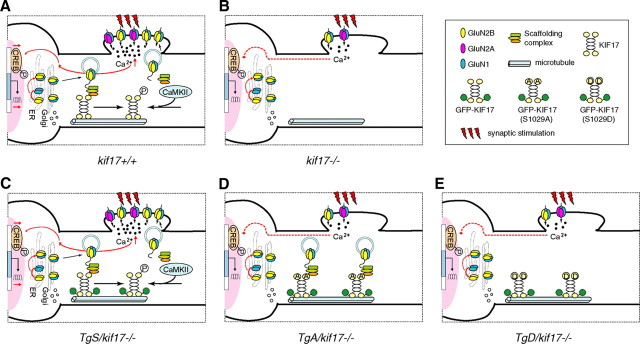
Regulation of NMDA receptor trafficking is crucial to modulate neuronal communication. Ca(2+)/calmodulin-dependent protein kinase phosphorylates the tail domain of KIF17, a member of the kinesin superfamily, to control NMDA receptor subunit 2B (GluN2B) transport by changing the KIF17-cargo interaction in vitro. However, the mechanisms of regulation of GluN2B transport in vivo and its physiological significance are unknown. We generated transgenic mice carrying wild-type KIF17 (TgS), or KIF17 with S1029A (TgA) or S1029D (TgD) phosphomimic mutations in kif17(-/-) background. TgA/kif17(-/-) and TgD/kif17(-/-) mice exhibited reductions in synaptic NMDA receptors because of their inability to load/unload GluN2B onto/from KIF17, leading to impaired neuronal plasticity, CREB activation, and spatial memory. Expression of GFP-KIF17 in TgS/kif17(-/-) mouse neurons rescued the synaptic and behavioral defects of kif17(-/-) mice. These results suggest that phosphorylation-based regulation of NMDA receptor transport is critical for learning and memory in vivo.


Figures

Figure 1.
Figure 1.
Generation and biochemical characterization of KIF17 transgenic mouse lines. A, Point mutation of the C-terminal domain KIF17 at Ser1029. The C-terminal domain of KIF17 is critical for cargo binding. Ser1029 is phosphorylated by CaMKII to regulate the KIF17–Mint1 interaction. S1029S: wild-type KIF17. S1029A: substitution of Ser1029 by Ala, which mimics the unphosphorylated state. S1029D: substitution of Ser1029 by Asp, which mimics the phosphorylated state. B, The construct for generation of KIF17 transgenic mice. KIF17 expression was restricted to the postnatal forebrain because of the use of CaMKIIα promoter. C, Expression of KIF17 in various tissues. KIF5B was used as a control. In transgenic mice, GFP-KIF17 was restricted to the postnatal forebrain (olfactory bulb, hippocampus, and cortex) by using the CaMKIIα promoter. D, Immunohistochemistry to examine KIF17 localization in forebrain regions: hippocampal CA1 (HIP) and cortex (CT) subregions. Scale bar, 100 μm. E, Schematic illustration of the procedure used to generate Tg+/kif17−/− mice. KIF17 transgenic mice (TgS, TgA, and TgD) were bred with kif17−/− mice to generate three new transgenic mouse lines with disrupted endogenous kif17 gene (TgS/kif17−/−, TgA/kif17−/−, and TgD/kif17−/−). F, PCR screening using primers for gfp, neo, and endogenous kif17. G, Paraffin sections of the mouse brain stained with hematoxylin and eosin. Scale bars, 500 μm (top right) and 200 μm (bottom right). H, Western blot analysis and quantification of GFP-KIF17 in the hippocampi and cortices of Tg+/kif17−/− mice. The lower bands indicate endogenous KIF17, and the upper bands indicate GFP-KIF17 fusion proteins. I, Immunoprecipitation of mouse hippocampal extracts using anti-KIF17 and anti-GFP antibodies; anti-IgG antibody was used as a negative control. J, K, The levels of KIF17, GluN2B and other associated proteins in the hippocampus of transgenic mice. Data from three independent experiments are expressed as mean ± SEM (*p < 0.01; one-way ANOVA and post hoc comparison test).
Figure 2.
Figure 2.
Performance in the Morris water maze task. A, Escape latencies during non-spatial pretraining (four trials per day). B, Escape latencies during spatial training. C, D, Probe test performed 24 h after the last training sessions. The escape platform was removed, and mice were allowed to swim for 60 s. Target quadrant searching time (C) and platform crossings (D, the number of times the mice cross the exact location of the platform) were calculated to evaluate the spatial learning ability of mice. TQ, Target quadrant; AL, adjacent left; OP, opposite; AR, adjacent right. The quadrant time (percentage) in TQ was as follows: kif17+/+, 44.8 ± 7.4%; kif17−/−, 25.4 ± 3.5%; TgS/kif17−/−, 40.6 ± 3.8%; TgA/kif17−/−, 30.4 ± 3.1%; TgD/kif17−/−, 27.9 ± 4.4%. The platform crossings were as follows: kif17+/+, 3.9 ± 0.3%; kif17−/−, 2.1 ± 0.3%; TgS/kif17−/−, 3.6 ± 0.6%; TgA/kif17−/−, 2.3 ± 0.4%; TgD/kif17−/−, 2.1 ± 0.3%. Values represent mean ± SEM (n = 8 mice/genotype, *p < 0.05; one-way ANOVA and post hoc test). E, Representative searching strategy during the probe test. Kif17+/+ and TgS/kif17−/− mice focused their search in the target quadrant, while kif17−/−, TgA/kif17−/−, and TgD/kif17−/− mice navigated over the entire area of the pool.
Figure 3.
Figure 3.
Synaptic NMDA receptor-mediated LTP and EPSCs. A, B, LTP induced by a single train of tetanus (100 Hz for 1 s, arrow) in hippocampal CA1 neurons of kif17+/+, kif17−/−, and Tg+/kif17−/− mice. Sample traces show typical fEPSPs recorded 5 min before and 60 min after LTP induction. Expression of LTP was attenuated in kif17−/−, TgA/kif17−/− and TgD/kif17−/− slices. C, D, AMPA- and NMDA-mediated EPSCs recorded in CA1 pyramidal neurons of kif17+/+, kif17−/−, and Tg+/kif17−/− mice. NMDA/AMPA ratios in neurons from kif17−/−, TgA/kif17−/− and TgD/kif17−/− mice were decreased, consistent with a decrease in NMDA-mediated currents (mean ± SEM, *p < 0.01; one-way ANOVA and post hoc test). NMDA/AMPA ratios in neurons of kif17+/+ and TgS/kif17−/− mice were not different. E, Input–output curves plotting the fEPSP slopes against their corresponding presynaptic fiber volley amplitudes. Each symbol represents a set of experiments from a single slice. F, Paired-pulse facilitation of fEPSPs was measured using pairs of presynaptic fiber stimulation pulses separated by 20, 50, 100, and 200 ms. For each group, the mean ± SEM is indicated. G, Current–voltage relationship of NMDA receptor channel currents recorded in hippocampal slices. Current amplitudes were normalized to the values at +40 mV EPSC. Values are mean ± SEM.
Figure 4.
Figure 4.
Dynamics of GluN2 subunits in live hippocampal neurons. A–D, Analysis of GluN2B motility. A, Time-lapse images of movement of GluN2B-RFP clusters in dendrites. Arrows point to anterogradely moving clusters. Scale bar, 5 μm. B, Kymograph showing the motility of GluN2B clusters. C, Classification of motility (p < 0.0001; χ2 test). D, Average velocities for anterograde and retrograde movement of GluN2B clusters. E–H, Analysis of GluN2A motility. E, Time-lapse images of movement of GluN2A-RFP clusters in dendrites. Arrows point to anterogradely moving clusters. Scale bar, 5 μm. F, Kymograph showing the motility of GluN2A clusters. G, Classification of motility (p = 0.90, χ2 test). H, Average velocities for anterograde and retrograde movement of GluN2A clusters. Data are expressed as mean ± SEM (n = 48 neurons from three animals/genotype, *p < 0.05; one-way ANOVA and post hoc test).
Figure 5.
Figure 5.
ER-to-Golgi and post-Golgi transport of GluN2 subunits in neurons. A–C, Dynamics of GluN2B-RFP after BFA washout. A, Hippocampal cultures were cotransfected with untagged GluN1–1a together with GluN2B-RFP vectors. After BFA washout, images were acquired at indicated time points. Scale bar, 20 μm. B, Fluorescence intensity of the Golgi and non-Golgi were expressed as ratios at 1 h after BFA washout (mean ± SEM, p > 0.05; one-way ANOVA and post hoc test). C, Percentage of released GluN2B-RFP signals from the Golgi region (mean ± SEM, *p < 0.05; one-way ANOVA and post hoc test). For quantification, 15 neurons from three mice of each genotype were examined. D–F, Dynamics of GluN2A-RFP after BFA washout. D, Hippocampal cultures were cotransfected with untagged GluN1–1a together with GluN2A-RFP vectors. After BFA washout, images were acquired at indicated time points. Scale bar, 20 μm. E, Fluorescence intensity of Golgi and non-Golgi were expressed as ratios at 1 h after BFA washout (mean ± SEM, p > 0.05; one-way ANOVA and post hoc test). F, Percentage of released GluN2A-RFP signals from the Golgi region (mean ± SEM, p > 0.05; one-way ANOVA and post hoc test). For quantification, 15 neurons from three mice of each genotype were examined.
Figure 6.
Figure 6.
Intracellular localization of GluN2B. A, B, Primary cultures of hippocampal neurons were double-stained with anti-GluN2B/synaptophysin (A) or anti-GluN2B/MAP2 (B) antibodies. Transgenically expressed KIF17 (green) was present in TgS/kif17−/−, TgA/kif17−/− and TgD/kif17−/− neurons. Arrows indicate colocalization of GFP-KIF17 and GluN2B in dendritic shafts. Scale bar, 10 μm. C, Quantification of the synaptic density of GluN2B-positive clusters (colabeled with anti-synaptophysin) in dendrites. D, Quantification of the density of GluN2B clusters in dendritic shafts (colabeled with anti-MAP2). E, Comparison of the distribution of GluN2B clusters in dendritic shafts and synapses. Twenty neurons from three animals were examined for each genotype. Data are expressed as mean ± SEM (*p < 0.01; one-way ANOVA and post hoc test).
Figure 7.
Figure 7.
Intracellular localization of GluN2A. A, B, Primary cultures of hippocampal neurons were double-stained with anti-GluN2A/synaptophysin (A) or anti-GluN2A/MAP2 (B) antibodies. GFP-fused KIF17 (green) was present in TgS/kif17−/−, TgA/kif17−/− and TgD/kif17−/− neurons. Scale bar, 10 μm. C, Quantification of the synaptic density of GluN2A-positive clusters (colabeled with anti-synaptophysin) in dendrites. D, Quantification of the density of GluN2A clusters in dendritic shafts (colabeled with anti-MAP2). E, Comparison of the distribution of GluN2A clusters in dendritic shafts and synapses. Twenty neurons from three animals were examined for each genotype. Data are expressed as mean ± SEM (*p < 0.01; one-way ANOVA and post hoc test).
Figure 8.
Figure 8.
Surface expression of endogenous GluN2B and GluN2A in hippocampal neurons. Surface-expressed proteins in cultured neurons were labeled and isolated, and then resolved by SDS-PAGE. A, Immunoblots of levels of GluN2B, GluN2A, and GluR1 in total extracts and surface components. B, Quantification of surface expression experiments. The intensities of GluN2B and GluN2A (total and surface) were normalized to GluR1. Data are expressed as mean ± SEM from three independent experiments. *p < 0.05; one-way ANOVA and post hoc test.
Figure 9.
Figure 9.
Receptor degradation analysis in hippocampal neurons. A, B, RT-PCR analysis of NMDA receptors in hippocampal extracts. Data are representative of three separate experiments. Values are expressed as mean ± SEM (*p < 0.05; one-way ANOVA and post hoc test). C, Representative immunoblots of levels of GluN2A and GluN2B in neurons treated with CHX (20 μg/ml) for 0, 10, 20, and 30 h, respectively. D, E, Quantification of GluN2A/2B degradation. Data were obtained from three independent experiments. Values are the average signal intensities (mean ± SEM) for GluN2A and GluN2B standardized to the signal intensity of tubulin and normalized to 100% at time 0 (*p < 0.05; one-way ANOVA and post hoc test). F, Representative immunoblots of levels of GluN2 subunits in neurons incubated with CHX for 20 h, in the presence or absence of lysosomal inhibitors (Leu, leupeptin, 100 μg/ml; CLQ, chloroquine, 200 μm), or proteasomal inhibitors (Lac, lactacystin, 10 μm; MG132, 10 μm). G, H, Quantification of changes in GluN2 subunits as shown in F, based on three independent experiments. Data are expressed as mean ± SEM.
Figure 10.
Figure 10.
CREB activation. A, Immunoblots of p-CREB, CREB, GluN2B, GluN2A, KIF17 and KIF5B in hippocampal homogenates from kif17+/+, kif17−/−, TgS/kif17−/−, TgA/kif17−/− and TgD/kif17−/− mice before and after water maze training. B, Quantification of immunoblots and mean values normalized to control (KIF5B). Data (mean ± SEM) were obtained from four independent experiments (*p < 0.05; one-way ANOVA and post hoc test).
Figure 11.
Figure 11.
Model for the regulation of KIF17-cargo interaction. A, In wild-type neurons, KIF17 binds to the scaffolding Mint1 complex to transport GluN2B-containing vesicles from the cell body to synaptic terminals in dendrites. CaMKII-dependent phosphorylation of KIF17 releases the NMDA receptor, facilitating its insertion at synapses. Synaptic NMDA receptor-mediated Ca2+ influx triggers LTP, activates signaling pathways and enhances CREB-dependent gene transcription. B, In kif17−/− neurons, lack of KIF17-mediated GluN2B transport leads to downregulation of GluN2B and GluN2A via different pathways, contributing to defects in synaptic plasticity and memory in kif17−/− mice. C, In TgS/kif17−/− neurons, GFP-KIF17 protein efficiently transports GluN2B-containing vesicles along dendrites; thus, the deficiencies in kif17−/− mice are rescued by the expression of GFP-KIF17 protein. D, In TgA/kif17−/− neurons, GFP-KIF17 S1029A binds to Mint1 and enables the transport of GluN2B vesicles from cell body to dendrites, but inability of CaMKII to phosphorylate GFP-KIF17 S1029A prevents the unloading and further synaptic recruitment of GluN2B vesicles. E, In TgD/kif17−/− neurons, GFP-KIF17 S1029D does not transport GluN2B vesicles, resulting in the accumulation of GluN2B subunits in the Golgi apparatus. Collectively, the defective transport of GluN2B, and the attenuated CREB responses result in a reduction in the level of synaptic GluN2B in both TgA/kif17−/− and TgD/kif17−/− neurons. The loss of GluN2B function appears to be a triggering factor for the proteasomal control of GluN2A degradation. In conclusion, TgA/kif17−/− and TgD/kif17−/− mice show impairments in synaptic plasticity and spatial memory because of insufficient levels of synaptic NMDA receptors.

Similar articles

Cited by

References

    1. Arimura N, Kaibuchi K. Neuronal polarity: from extracellular signals to intracellular mechanisms. Nat Rev Neurosci. 2007;8:194–205. - PubMed
    1. Arimura N, Kimura T, Nakamuta S, Taya S, Funahashi Y, Hattori A, Shimada A, Ménager C, Kawabata S, Fujii K, Iwamatsu A, Segal RA, Fukuda M, Kaibuchi K. Anterograde transport of TrkB in axons is mediated by direct interaction with Slp1 and Rab27. Dev Cell. 2009;16:675–686. - PubMed
    1. Bannerman DM, Good MA, Butcher SP, Ramsay M, Morris RGM. Distinct components of spatial learning revealed by prior training and NMDA receptor blockade. Nature. 1995;378:182–186. - PubMed
    1. Barria A, Malinow R. Subunit-specific NMDA receptor trafficking to synapses. Neuron. 2002;35:345–353. - PubMed
    1. Bliss TVP, Collingridge GL. A synaptic model of memory: long-term potentiation in the hippocampus. Nature. 1993;361:31–39. - PubMed

Publication types

MeSH terms

Substances