. 2012 Apr 18;32(16):5609-19.
doi: 10.1523/JNEUROSCI.5158-11.2012.

Spatial profile of excitatory and inhibitory synaptic connectivity in mouse primary auditory cortex

Affiliations

Spatial profile of excitatory and inhibitory synaptic connectivity in mouse primary auditory cortex

Robert B Levy et al. J Neurosci. .

Abstract

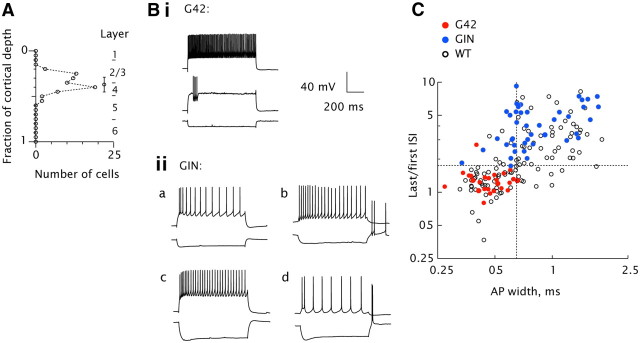
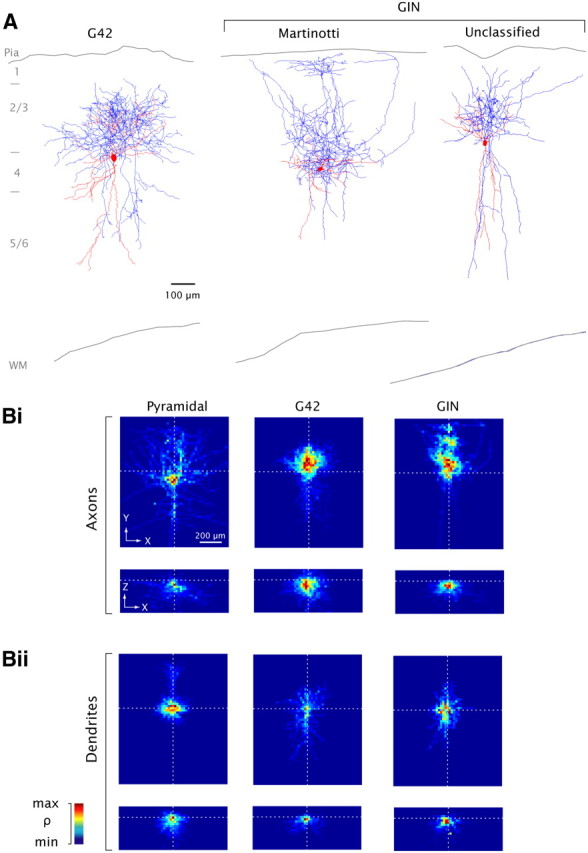
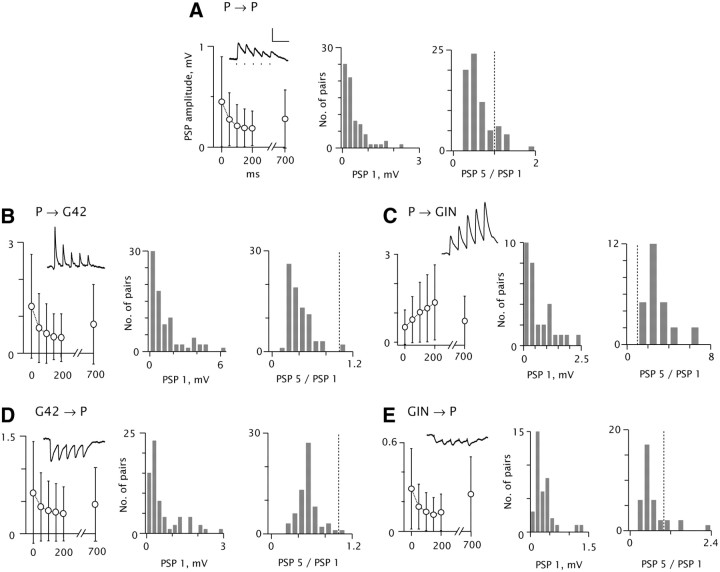
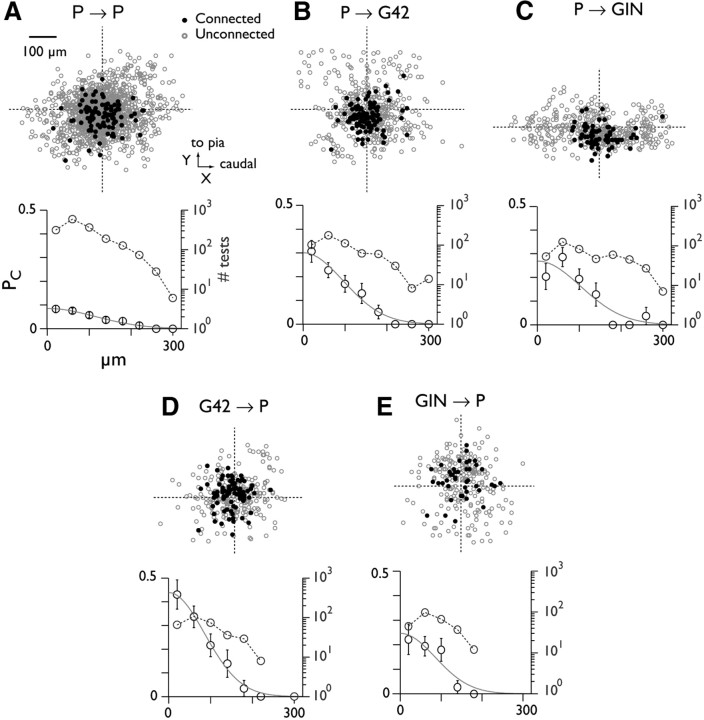
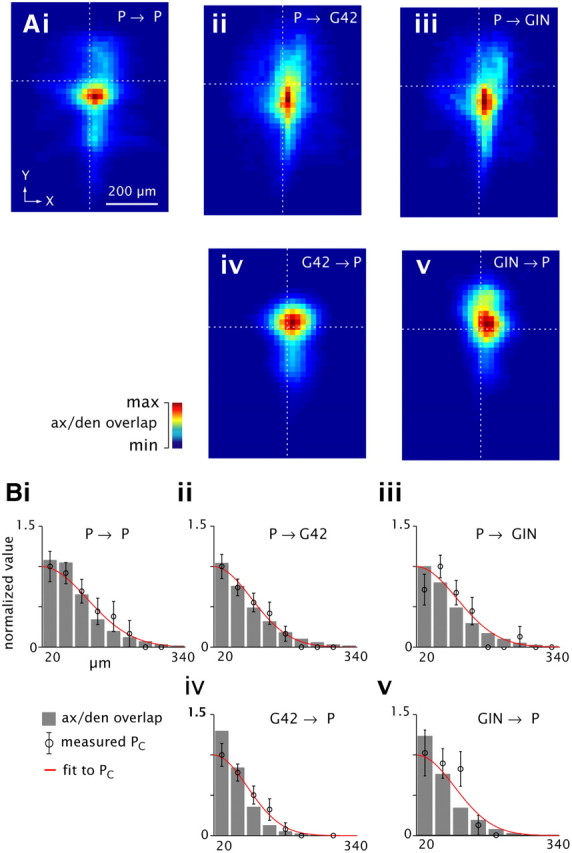
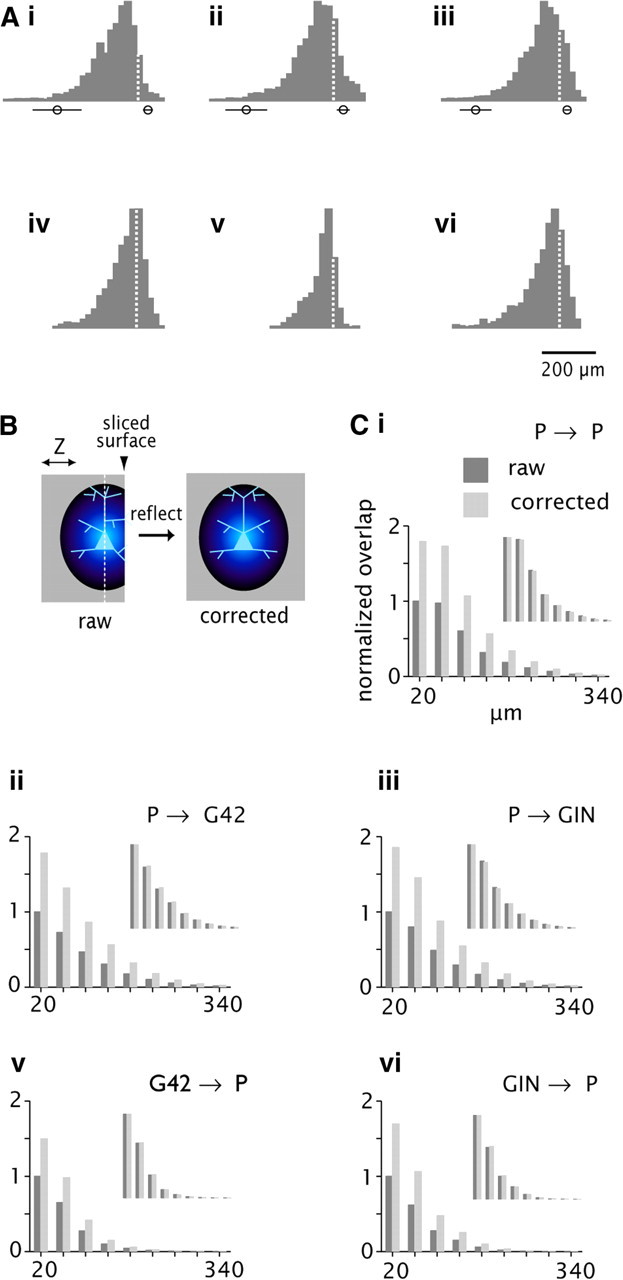
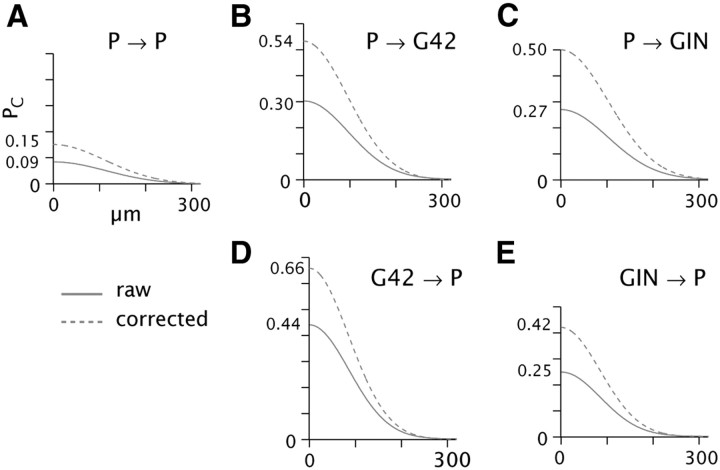
The role of local cortical activity in shaping neuronal responses is controversial. Among other questions, it is unknown how the diverse response patterns reported in vivo-lateral inhibition in some cases, approximately balanced excitation and inhibition (co-tuning) in others-compare to the local spread of synaptic connectivity. Excitatory and inhibitory activity might cancel each other out, or, whether one outweighs the other, receptive field properties might be substantially affected. As a step toward addressing this question, we used multiple intracellular recording in mouse primary auditory cortical slices to map synaptic connectivity among excitatory pyramidal cells and the two broad classes of inhibitory cells, fast-spiking (FS) and non-FS cells in the principal input layer. Connection probability was distance-dependent; the spread of connectivity, parameterized by Gaussian fits to the data, was comparable for all cell types, ranging from 85 to 114 μm. With brief stimulus trains, unitary synapses formed by FS interneurons were stronger than other classes of synapses; synapse strength did not correlate with distance between cells. The physiological data were qualitatively consistent with predictions derived from anatomical reconstruction. We also analyzed the truncation of neuronal processes due to slicing; overall connectivity was reduced but the spatial pattern was unaffected. The comparable spatial patterns of connectivity and relatively strong excitatory-inhibitory interconnectivity are consistent with a theoretical model where either lateral inhibition or co-tuning can predominate, depending on the structure of the input.


Figures

Figure 1.
Figure 1.
Characterization of recorded neurons. A, Location of somata as a fraction of total cortical depth (from pia to white matter), for all biocytin-filled cells (n = 72). Circle with bars denotes mean and SD (0.37 ± 0.08). Laminar boundaries are indicated. B, representative firing patterns in G42 (i) and GIN cells (ii). Injected currents were (in nA): −0.05/0.15/0.35 (i); −0.05/0.15 (iia); −0.01/0.01 (iib); −0.08/0.13 (iic); −0.08/0.03 (iid). C, Action potential width (abscissa) versus degree of adaptation (last/first interspike interval (ISI), ordinate) for G42 (red circles), GIN (blue circles), and all inhibitory neurons in WT mice (open circles). Dashed lines denote boundaries for classifying WT cells as fast-spiking or non-fast-spiking (AP width 0.65 ms, ISI ratio 1.75).
Figure 2.
Figure 2.
Anatomical reconstruction. A, representative G42 (left) and GIN neurons (middle, right). Red, soma and dendrites; blue, axons. Approximate laminar boundaries and outlines of pia and white matter (WM) are indicated. B, Average process length density (ρ) maps for all reconstructed cells of each type, with somata aligned (see Materials and Methods, Morphology). n = 7 cells of each type (axons), n = 5 (dendrites), except for GIN neurons where n = 5 (dendrites), n = 3 (axons). The 3-dimensional process length density maps are projected onto the XY plane (Bi, Bii, top) and the XZ plane (Bi, Bii, bottom). Values are normalized separately for each panel.
Figure 3.
Figure 3.
Synapse strength and dynamics. Data are grouped according to presynaptic and postsynaptic cell type, as indicated. AE, Left, pooled data (mean and SD) for mean peak PSP amplitudes, 20 Hz train and recovery response (note X scale discontinuity). Insets, example postsynaptic voltage traces. Spike times are indicated by tick marks in A. Scale: 100 ms, 0.5 mV. Resting Vm = −69 mV (A), −67 (B), −64 (C), −66 (D), −59 (E). AE, Middle, histograms of mean amplitude of the first PSPs. A 7.6 mV EPSP in B is not shown. AE, Right, histograms of the ratio of the amplitude of the last (PSP 5) to the first (PSP 1) response in the 20 Hz train. Dashed lines denote PSP 5/PSP 1 = 1. n = 71 (A), 80 (B), 30 (C), 65 (D), 37 (E) pairs.
Figure 4.
Figure 4.
Synaptic PC versus intersomatic distance. A, Data for pyramid-pyramid pairs. Top, scatter plot showing location of unconnected (gray) and connected (black) postsynaptic somata relative to the presynaptically tested cell (intersection of dashed lines). Bottom, connection probability (mean ± SEM; circles with error bars) versus radial distance between somata. Data are divided into 40 μm bins. Curves are Gaussian fits to the data. Circles with dashed line denote the number of tests at each distance (right-hand axis; note log scale). B–E, Data for pyramid-interneuron connections.
Figure 5.
Figure 5.
Connection profiles predicted by morphology; comparison to physiology data. Ai–Av, total overlap between presynaptic axons and postsynaptic dendrites (color scale, normalized to peak value for each panel) versus intersomatic distance (X, Y) axes, derived from the cross-correlation of 3-D axonal and dendritic length density maps (Fig. 2B; see Materials and Methods, Morphology). Dashed lines denote intersomatic distance = 0. Bi–Bv, axonal/dendritic overlap as a function of radial distance between somata (gray bars), scaled for best fit to normalized measured PC profiles (circles with error bars; compare Fig. 4); Gaussian fits to PC profiles are superimposed (red).
Figure 6.
Figure 6.
Effect of slicing on connectivity profiles. Ai–Avi, Normalized histograms of process length density on the z-axis (orthogonal to the cut surface). Data are derived from the density maps in Figure 2B. Dashed lines at X = 0 denote location of the soma. Circles with bars denote the mean and SD of the location of the deep (left) and superficial (right) cut surfaces. B, Schematic diagram of the correction procedure. Blue ovoid denotes the 3-D process length density map, projected here onto the YZ plane. The map is truncated at the cut surface (arrowhead) in the raw data, left. White dashed line denotes XY plane passing through the soma (pale blue). Reflecting around this plane produces the corrected map, right. Ci–Cvi, axonal/dendritic overlap (left axis) versus radial distance (bottom axis) for the raw data corrected (dark gray bars) compared with the corrected (light gray). Scale is normalized to the peak value for the raw data in each panel. Insets, same data with separate normalization for raw and corrected, respectively.
Figure 7.
Figure 7.
AE, Estimation of PC profiles after correction for slicing. Solid lines are Gaussian fits to the physiology data for PC versus distance; compare Figure 4, bottom panels. Dashed lines are the same curves multiplied by a scale factor representing the ratio of axonal/dendritic overlap for the corrected versus raw process length density maps (see Figs. 5, 6; Results). Peak values are indicated on left axis.

References

    1. Bandyopadhyay S, Shamma SA, Kanold PO. Dichotomy of functional organization in the mouse auditory cortex. Nat Neurosci. 2010;13:361–368. - PMC - PubMed
    1. Barbour B, Isope P. Combining loose cell-attached stimulation and recording. J Neurosci Methods. 2000;103:199–208. - PubMed
    1. Beierlein M, Gibson JR, Connors BW. Two dynamically distinct inhibitory networks in layer 4 of the neocortex. J Neurophysiol. 2003;90:2987–3000. - PubMed
    1. Blasdel GG, Lund JS. Termination of afferent axons in macaque striate cortex. J Neurosci. 1983;3:1389–1413. - PMC - PubMed
    1. Brown SP, Hestrin S. Intracortical circuits of pyramidal neurons reflect their long-range axonal targets. Nature. 2009;457:1133–1136. - PMC - PubMed

Publication types

MeSH terms

Substances

LinkOut - more resources