

Changes to airborne pollen counts across Europe
- PMID: 22514618
- PMCID: PMC3325983
- DOI: 10.1371/journal.pone.0034076
Changes to airborne pollen counts across Europe
Abstract
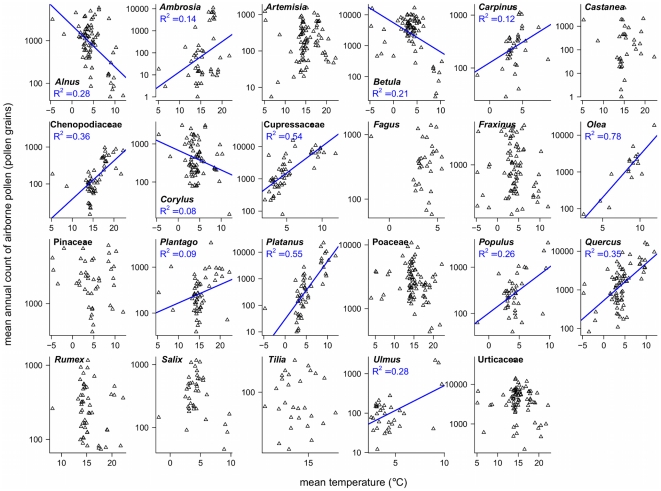
A progressive global increase in the burden of allergic diseases has affected the industrialized world over the last half century and has been reported in the literature. The clinical evidence reveals a general increase in both incidence and prevalence of respiratory diseases, such as allergic rhinitis (common hay fever) and asthma. Such phenomena may be related not only to air pollution and changes in lifestyle, but also to an actual increase in airborne quantities of allergenic pollen. Experimental enhancements of carbon dioxide (CO[Formula: see text]) have demonstrated changes in pollen amount and allergenicity, but this has rarely been shown in the wider environment. The present analysis of a continental-scale pollen data set reveals an increasing trend in the yearly amount of airborne pollen for many taxa in Europe, which is more pronounced in urban than semi-rural/rural areas. Climate change may contribute to these changes, however increased temperatures do not appear to be a major influencing factor. Instead, we suggest the anthropogenic rise of atmospheric CO[Formula: see text] levels may be influential.
Conflict of interest statement
Figures
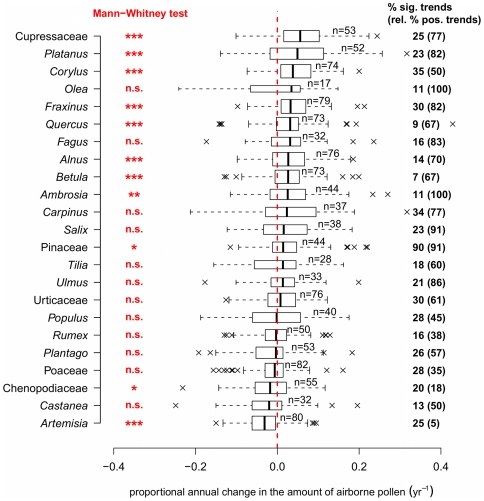
 , ** :
  , *** :
  , n.s.:
  ) for 11 taxa. On the right, the percentages of significant trends are indicated for each taxon (of which the percentages of positive trends are given in parentheses). The height of the boxplot is related to sample size, taxa are arranged in decreasing order of their medians.
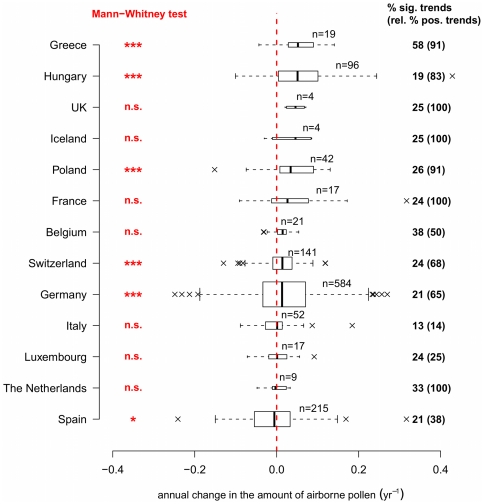
 , ** :
  , *** :
  , n.s.:
  ) for six countries. On the right, the percentages of significant trends are indicated for each country (of which the percentages of positive trends are given in parentheses). The height of the boxplot is related to sample size, countries are arranged in decreasing order of their medians.
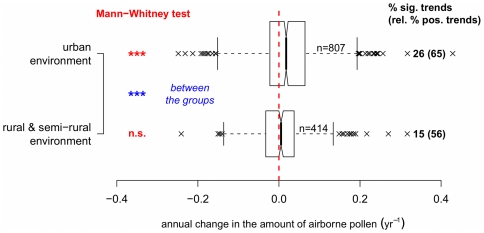
 ) of airborne pollen in urban environments. The notches are calculated as
  and the height of each boxplot is related to sample size. On the right, the percentages of significant trends are indicated for each type of environment (of which the percentages of positive trends are given in parentheses).
References
-
- Beggs PJ. Impacts of climate change on aeroallergens: past and future. Clin Exp Allergy. 2004;34:1507–1513. - PubMed
-
- D'Amato G, Cecchi L, Bonini S, Nunes C, Annesi-Maesano I, et al. Allergenic pollen and pollen allergy in Europe. Allergy. 2007;62:976–990. - PubMed
-
- D'Amato G, Cecchi L. Effects of climate change on environmental factors in respiratory allergic diseases. Clin Exp Allergy. 2008;38:1264–1274. - PubMed
Publication types
MeSH terms
Substances
LinkOut - more resources
Full Text Sources
