. 2012 Apr 17;22(4):811-23.
doi: 10.1016/j.devcel.2012.02.004.

The clathrin adaptor AP-1A mediates basolateral polarity

Affiliations

The clathrin adaptor AP-1A mediates basolateral polarity

Diego Gravotta et al. Dev Cell. .

Abstract

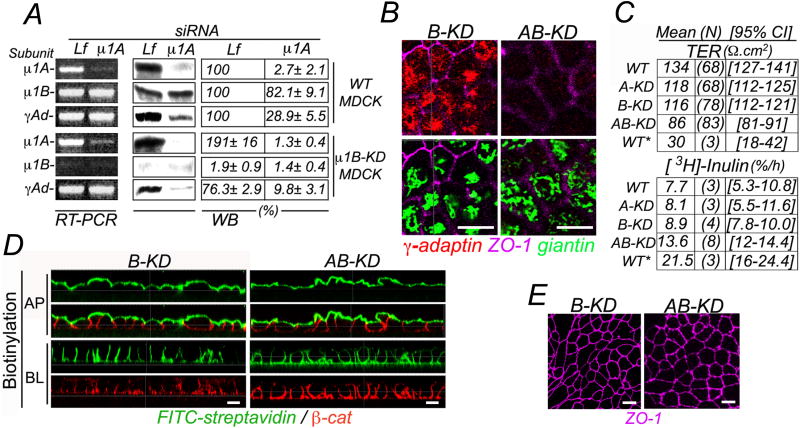
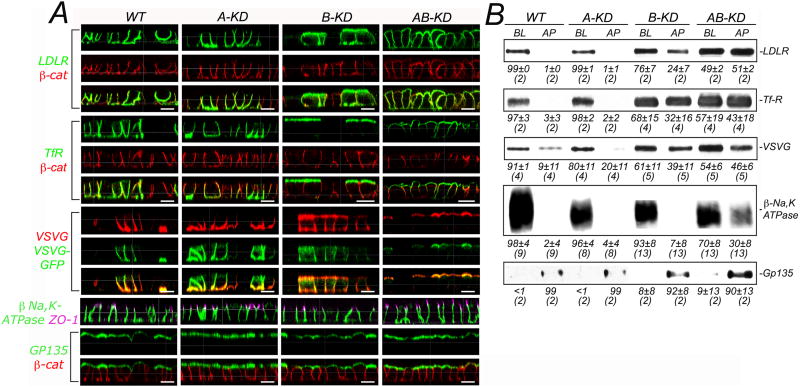
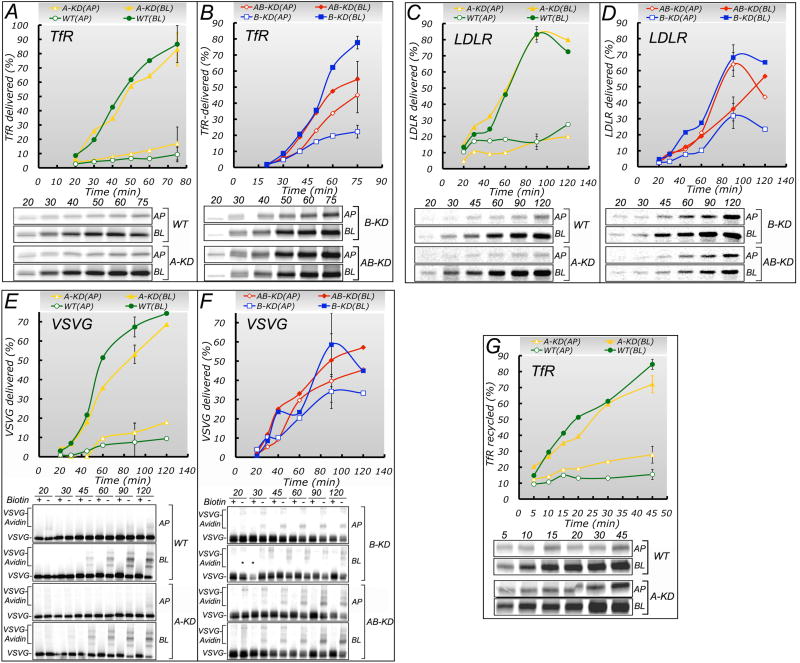
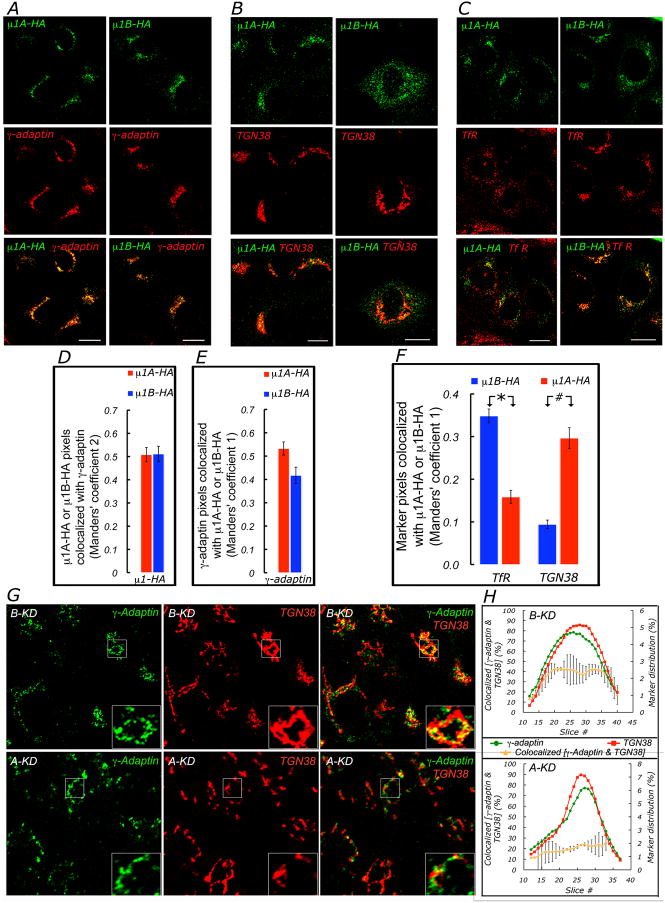
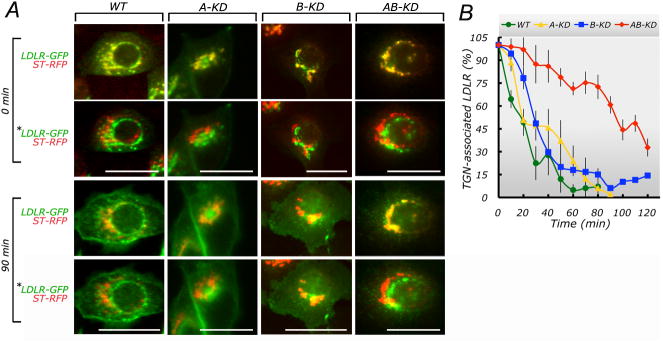
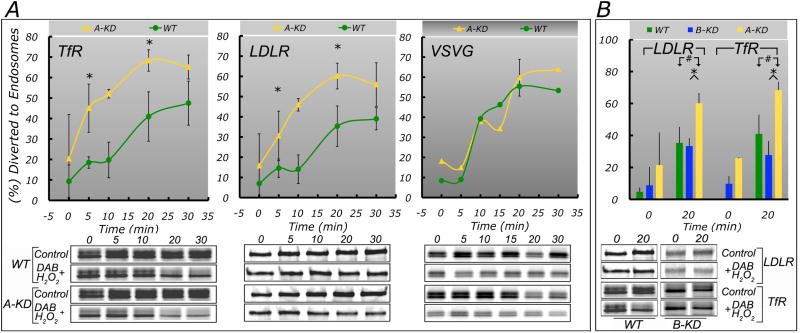
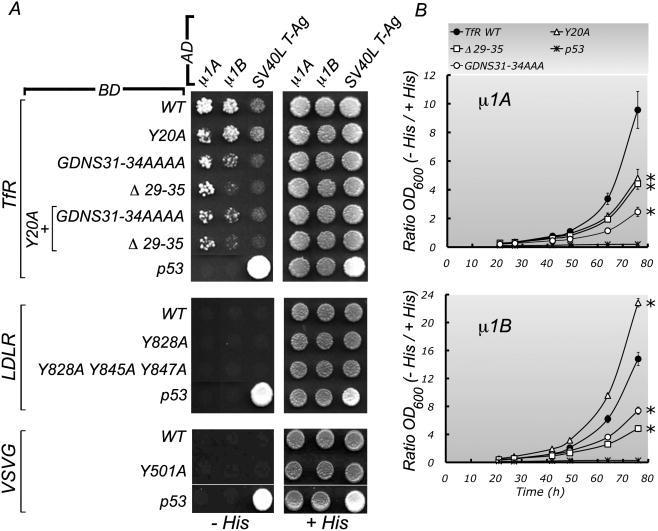
Clathrin and the epithelial-specific clathrin adaptor AP-1B mediate basolateral trafficking in epithelia. However, several epithelia lack AP-1B, and mice knocked out for AP-1B are viable, suggesting the existence of additional mechanisms that control basolateral polarity. Here, we demonstrate a distinct role of the ubiquitous clathrin adaptor AP-1A in basolateral protein sorting. Knockdown of AP-1A causes missorting of basolateral proteins in MDCK cells, but only after knockdown of AP-1B, suggesting that AP-1B can compensate for lack of AP-1A. AP-1A localizes predominantly to the TGN, and its knockdown promotes spillover of basolateral proteins into common recycling endosomes, the site of function of AP-1B, suggesting complementary roles of both adaptors in basolateral sorting. Yeast two-hybrid assays detect interactions between the basolateral signal of transferrin receptor and the medium subunits of both AP-1A and AP-1B. The basolateral sorting function of AP-1A reported here establishes AP-1 as a major regulator of epithelial polarity.


Figures

Figure 1
Figure 1. Single and double knock-down of AP-1A and AP-1B in MDCK cells
MDCK cells, wild type (WT) or permanently depleted of μ1B with shRNA (μ1B-KD) (Gravotta et al., 2007) were transfected by electroporation with control siRNA targeting luciferase (Lf) or μ1A siRNA for three consecutive times (at 3 day-intervals each, see Experimental Procedures) and studied 84 h after the third transfection. (A) RT-PCR (200ng RNA input) and Western blot (WB, 125ug protein/lane); values expressed as % of WT MDCK represent average ± SE.M of three independent experiments. Expression in μ1A siRNA-transfected, relative to Lf siRNA-transfected MDCK cells consistently demonstrated >90% reduction of μ1 A in both WT and B-KD MDCK cells (p < 1.4×10⁻⁶ and 1.0×10⁻⁹). A-KD cells had no compensatory increase of μ1B (Fig. 1A; p < 0.12), unlike B-KD cells which exhibited increased μ1A levels (Fig. 1A; p < 0.004), as previously shown (Gravotta et al., 2007). RT-PCR analysis did not detect any decrease in γ-adaptin mRNA levels in A-KD, B-KD or AB-KD cells whereas Western blotting detected decreases in protein levels of ∼71 % (p < 2.0×10⁻⁴), 25% (p < 0.0012) or 92% (p < 8.3×10⁻⁶), respectively, relative to WT MDCK cells. (B) Immunofluorescence microscopy in permeabilized AB-KD MDCK cells confirmed the strong reduction of γ-adaptin in the perinuclear region, highlighted by staining of the Golgi-resident protein giantin. Bar, 12 μm. (C) The trans-epithelial electrical resistance (TER) was slightly decreased, in A-KD (12%, p<1×10⁻³), and B-KD (14%, p<6×10⁻⁵) MDCK cells, and moderately decreased in AB-KD (30%, p<2×10⁻¹⁶) MDCK cells compared to WT MDCK cells, although considerably less than in WT MDCK cells treated with Ca,Mg–free HBSS for 1.5h (WT*) (78%, p=2×10⁻⁸). Inulin permeability was not significantly reduced, relative to WT MDCK cells (7.7% leaked to the opposite chamber) in A-KD (8%, p<1) or B-KD (8.9%, p<0.79) but was significantly reduced in AB-KD ( 13.6%, p<2×10⁻⁶) MDCK cells. Values shown represent the means of the indicated number of independent measurements (N) and 95% confidence interval (CI). For statistical analysis, see table S1. (D) Domain selective biotinylation of MDCK monolayers grown on polycarbonate filters demonstrate preservation of TJ, as assessed by staining with FITC-streptavidin from the apical or basolateral side (see Experimental Procedures for details). Bar, 12 μm. (E) The morphology of tight junctions was normal in B-KD and AB-KD MDCK cells as revealed by immunostaining of ZO-1. Bar, 12 μm.
Figure 2
Figure 2. Steady-state distribution of polarity markers in A-KD, B-KD and AB-KD MDCK cells
A-KD, B-KD and AB-KD MDCK cells, generated as described in the legend to Fig. 1 and plated on polycarbonate filters, were analyzed for the polarized distribution of several endogenous and exogenous PM markers by (A) immunofluorescence or (B) domain-selective biotinylation, streptavidin-agarose retrieval and Western blotting. The distributions of LDL receptor (LDLR), transferrin receptor (TfR) and GFP-tagged vesicular stomatitis virus G protein (VSVG-GFP) were monitored in cell monolayers transduced with the respective adenoviruses 50-54 h after plating and processed for immunofluorescence 26-30 h later (for details, see Experimental Procedures). The remaining markers (NaK-ATPase, β-catenin and gp135) were all endogenous to MDCK cells. (A) Immunofluorescence and confocal microscopy. Cell surface immunolabeling was performed on paraformaldehyde fixed monolayers grown on Transwell chambers, incubated with the respective antibodies to the PM proteins added to both apical and basolateral domains followed by a secondary antibody (shown in green for all proteins except for VSVG-GFP displayed in red). In a second step, cells were permeabilized with saponin to decorate p-catenin or ZO-1 with specific antibodies (shown in red and purple, respectively). Samples were analyzed using a Leica SP2 scanning confocal microscope and images are displayed as x-z sections. Bar, 12 μm (B) Domain-selective biotinylation. Cell surface proteins, subjected to domain-selective biotinylation from the apical (AP) or basolateral (BL) domains and recovered by streptavidin-agarose from cell lysates were analyzed by SDS-PAGE followed by Western blotting. Proteins identified with their respective antibodies, were visualized by chemiluminescence and quantified by NIH-imaging software. Values represent the means ± SD of the number of independent experiments shown between parentheses. Note that B-KD and AB KD (but not A-KD) MDCK cells display loss of polarity of LDLR, TFR and VSVG protein. In contrast, NaK-ATPase polarity is only moderately reduced in AB-KD MDCK cells, whereas the apical PM protein gp135 remains apically polarized under all experimental conditions.
Figure 3
Figure 3. Effect of AP-1A and AP-1B knock down on the biosynthetic delivery and recycling of basolateral PM proteins
Biosynthetic (A, F) sorting of several basolateral PM proteins was studied in A-KD, B-KD and AB-KD MDCK cells confluent on polycarbonate filters for 84 h, as detailed in Experimental Procedures. The surface arrival of indicated [35S]-labeled newly synthesized proteins was measured in cells transduced with adenoviruses encoding hTfR, hLDLR or VSVG-GFP, using, ligand capture (TfR) (AB), surface immunoprecipitation (LDLR) (C, D) or surface biotinylation-avidin shift assay (VSVG) (E, F) (see Experimental Procedures for details). Time points showing standard deviation bars represent the average of 4-6 independent experiments; these data and their statistical analysis by ANOVA along with the Bonferroni and Holm corrections for multiple comparisons are shown in table S2. G. The recycling of TfR was studied using a modification of the ligand-capture assay used to measure biosynthetic delivery (see Experimental Procedures) in WT and A-KD MDCK cells. Each time point represents the average of at least two independent experiments. The 45 min time point, showing standard deviation bars, represents the average of 4-6 independent experiments. These data and their statistical analysis by ANOVA along with the Bonferroni and Holm corrections for multiple comparisons are shown in table S2.
Figure 4
Figure 4. Co-localization of AP-1A and AP-1B with TGN and recycling endosome markers
MDCK cells were transfected with cDNAs encoding μ1A-HA or μ1B-HA, cultured as subconfluent monolayers for 72 hours, fixed with paraformaldehyde and permeabilized with saponin and processed for double immunofluorescence and scanning confocal microscopy, as described in Experimental Procedures (A) Monolayers decorated with antibodies to HA and γ-adaptin demonstrated co-localization of μ1A and μ1B with γ-adaptin. Bar, 15 μm. (D,E) Colocalization was analyzed using Manders colocalization coefficients (see supplementary methods). Note the high proportion_(∼ 50%) of both μ1A-HA and μ1B-HA that colocalized with endogenous γ-adaptin, reflecting their incorporation into the AP-1 complex. Manders' coefficient 2: 0.508 ± 0.030 and 0.511 ± 0.033, respectively (n= 30, 33 cells, p > 0.95, for μ1A-HA and μ1B-HA (Student's t-test). (E) Conversely, there was also a high co-localization of γ-adaptin with μ1A-HA or μ1B-HA, Manders' coefficient 1 0.532 ± 0.028 and 0.417 ± 0.035, respectively (n= 30, 33 cells, p > 0.013). (B,C) Cells were immunolabeled with antibodies to influenza HA-tag, TGN38 or Transferrin Receptor (TfR). Cells expressing moderate amounts of μ1A-HA or μ1B-HA displayed a perinuclear distribution similar to that observed for TGN38 and γ-adaptin. TfR distributed in both perinuclear and peripheral endosomes Scale bar= 20um. (f) Values representing mean ± SEM were derived from three independent co-localization experiments of μ1A-HA or μ1B-HA with TGN38- or TfR-labeled compartments. μ1A-HA co-localized more prominently with TGN38 than μ1B-HA(Manders' coefficient 1 = 0.294 ± 0.025 and 0.094 ± 0.010, n=41-40 cells, respectively; [#] p < 3.5 × 10⁻¹⁰, Student's t-test). In contrast, μ1B-HA co-localized more prominently with TfR than μ1A-HA Manders' coefficient 1= 0.348 ± 0.016 and 0.158 ± 0.015, n=69 and 44 cells, respectively; [*] p < 2.8 × 10⁻¹³, Student's t-test).(G). A-KD and B-KD MDCK cells, confluent for 84 h, were fixed, immunostained for TGN38 and γ-adaptin, and analyzed by laser scanning confocal microscopy as detailed in Supplementary Information, Experimental Procedures. Shown in the graphs at right are the relative areas expressed as percent values, occupied by TGN38 (red line) and γ-adaptin (green line) in each confocal slice (right ordinate), numbered starting from the top of the monolayer (abscissa), along with the percent colocalization of γ-adaptin with TGN38 (brown line) in A-KD and B-KD. Note that the colocalization of γ-adaptin with TGN38, expressed as the mean ± SD of the fraction of TGN38 area colocalized with γ-adaptin (brown line), is 34 ± 9.8% in B-KD cells and 20 ± 3.4% in A-KD cells (from n ∼ 144-176 cells). The difference was statistically significant (p< 0.0073) (Student's t-test). (Bars,15 μm)
Figure 5
Figure 5. Double knock-down of AP-1A and AP-1B blocks TGN exit of LDLR-GFP
Subconfluent control, A-KD, B-KD or AB-KD MDCK cells, grown on glass coverslips, were microinjected with expression vectors encoding ST-RFP and LDLR-GFP, incubated at 37oC for 1 h to allow synthesis of the protein and at 20oC for 2 h in the presence of 100 ng/ml cycloheximide, to accumulate LDLR-GFP in the TGN. The cells were then live imaged using a 40× objective in the red and green channels (see movie S1 and Experimental Procedures). (A) Fluorescent imaging. Note that in control cells LDLR-GFP co-localizes with ST-RFP at chase time 0 but loses colocalization at 90 min, as LDLR-GFP exits the TGN. A similar result was observed for A-KD and B-KD MDCK cells. In AB-KD cells LDLR-GFP colocalizes to a large extent with ST-RFP at chase times 90 min, indicating that a large fraction of LDLR-GFP displayed a delayed perinuclear exit. Paired images in each panel labeled with an asterisk (*) were generated by pixel-shift of green channel, to better appreciate area of colocalization. Bar, 20 μm. (B) Quantification of TGN exit kinetics. The figure shows the GFP/RFP fluorescence ratios at different chase times. Note that LDLR exit kinetics is not reduced in A-KD or B-KD MDCK cells but is slower in AB-KD MDCK cells. Time courses for LDLR Golgi exit were fit to a simple exponential decay model using the non-linear least squares function in the R software package. The time constant for AB-KD cells was determined to be 75.3 min (95% confidence interval = 64.6 min - 87.7 min; 3 traces). This was significantly slower that the time constants determined for the WT cells (23.9 min, 95% confidence interval = 19.6 min - 28.7 min; 3 traces), the A-KD cells (21.3 min; 95% confidence interval = 17.5 min - 25.5 min; 5 traces), and the B-KD cells (29.9 min; 95% confidence interval = 27.1 min - 32.7 min; 5 traces).
Figure 6
Figure 6. AP-1A knock-down enhances trafficking of LDLR and TfR into CRE
Wild type, A-KD and B-KD MDCK cells, confluent on Transwell chambers for 54 h were transduced either with adenoviruses encoding TfR and LDLR or with adenoviruses encoding TfR and VSVG-GFP for 26-30 h (see Experimental Procedures for details). The cells were then pulsed with [35S]-methionine/cysteine for 15 min, followed by a 2 h chase at 20°C in the presence of horseradish peroxidase-conjugated transferrin (HRP-Tf) to accumulate the radioactively labeled proteins in the TGN and the HRP-Tf in recycling endosomes. Next, the cells were chased at 37°C for the indicated times, in the presence of HRP-Tf, chilled and incubated with DAB/H2O2 to crosslink and trap proteins present in RE loaded with HRP-Tf. Samples were extracted, subjected to immuno-precipitation with antibodies to LDLR, TfR or VSVG protein and analyzed by SDS-PAGE as described in Experimental Procedures. The percent of the radioactively pulse-labeled proteins that became non-extractable upon HRP- and DAB/H2O2- induced-crosslinking was calculated as the difference between control and DAB/H2O2-treated samples and represents the amount of cargo protein diverted into CRE. (A) Values at each time point are average ± SEM from three independent experiments for LDLR an TfR, or from a single experiment for VSVG. Values at 0 and 20 min time points include additional experiments run in triplicates for LDLR and TfR (n=6) and for VSVG (n=7) in A-KD and WT MDCK cells. See table S3 for statistical analysis, (B) Endosomal trafficking in A- and B-KD MDCK cells. Bars represent average ± SEM values at 0 min and 20 min time points for LDLR or TfR in A- or B-KD cells from two independent experiments (n=4). Bar values for LDLR and TfR in A-KD and WT MDCK cells are as described in panel A. Note that the amounts of LDLR and TfR transported into CRE in B-KD or WT MDCK cells were not statistically different from each other. In contrast LDLR and TfR diverted into CRE in A-KD MDCK cells was significantly higher than either B-KD or WT MDCK cells. See table S3 for statistical analysis.
Figure 7
Figure 7. Yeast two-hybrid analysis of potential interactions between μ1A and μ1B subunits and the cytoplasmic tails of TfR, LDLR and VSVG
A. Plate assays. The μ1A/μ1B and the cytoplasmic tail constructs were subcloned into Y2H activation domain (AD) and binding domain (BD) vectors, respectively (for details, see Experimental Procedures). Analysis of the TfR cytoplasmic tail indicated that the interaction with u1A is dependent on both the YTRF sequence (amino acids 20-23; consensus motif YXXØ) and the GDNS sequence (amino acids 31-34), while the interaction with μ1B depends exclusively on GDNS. The lack of interaction of the human LDLR constructs with μ1A and μ1B subunits was also observed when the configuration of the assay was inverted by subcloning the LDLR constructs into the AD vector pGAD424 and the μ1A and μ1B constructs into the BD vector pGBT9 (not shown). Interaction of fusion proteins was monitored by activation of HIS3 transcription following plating of AH109 yeast strain double transformants on medium lacking His, Leu and Trp (-His). Plating on medium lacking only Leu and Trp (+His) provided a control for growth and loading of double transformants. B. Liquid medium Y2H assays. Triplicate cultures in +His and -His liquid media of the different double transformants were inoculated at high dilution (OD600 nm ∼0.001) and cultured for up to 76 h. The OD600 were recorded at the indicated intervals on undiluted samples or dilutions that did not exceed OD600 values of ∼0.5. Results were expressed as the OD600 in -His medium at the indicated times divided by the OD600 in +His medium at 21 h, to correct for differences in the density of the initial inocula (the OD600 in +His medium at 21 h was used to avoid values exceeding the range of linearity between OD and number of cells). Growth curves of p53-μ1A and p53- μ1B double transformants were included as negative controls of interactions for μ1A and μ1B, respectively (dashed lines in left and right panels). The data shown are the means +/-SEM of triplicate growth curves for each double transformant. The data points at 64 h and 76 h were analyzed by ANOVA followed by two-tail Dunnett's test. Asterisks at the side of the 76 h data points indicate significant differences at p<0.01 when compared to the TfR WT tail. The same significances were obtained when analyzing the 64 h data points with the exception of the comparison of the TfR WT and Y20A mutant interaction with μ1A, which was significant at p<0.05 instead of p<0.01 (asterisks are not shown for simplicity).

References

    1. Alberts B. Molecular biology of the cell. 4th. New York: Garland Science; 2002.
    1. Ang AL, Taguchi T, Francis S, Folsch H, Murrells LJ, Pypaert M, Warren G, Mellman I. Recycling endosomes can serve as intermediates during transport from the Golgi to the plasma membrane of MDCK cells. J Cell Biol. 2004;167:531–543. - PMC - PubMed
    1. Baust T, Czupalla C, Krause E, Bourel-Bonnet L, Hoflack B. Proteomic analysis of adaptor protein 1A coats selectively assembled on liposomes. Proc Natl Acad Sci U S A. 2006;103:3159–3164. - PMC - PubMed
    1. Bonifacino JS, Traub LM. Signals for sorting of transmembrane proteins to endosomes and lysosomes. Annu Rev Biochem. 2003;72:395–447. - PubMed
    1. Bryant DM, Mostov KE. From cells to organs: building polarized tissue. Nat Rev Mol Cell Biol. 2008;9:887–901. - PMC - PubMed

Publication types

MeSH terms

LinkOut - more resources