. 2012 Apr 17;21(4):577-92.
doi: 10.1016/j.ccr.2012.02.018.

Altered microenvironmental regulation of leukemic and normal stem cells in chronic myelogenous leukemia

Affiliations

Altered microenvironmental regulation of leukemic and normal stem cells in chronic myelogenous leukemia

Bin Zhang et al. Cancer Cell. .

Abstract

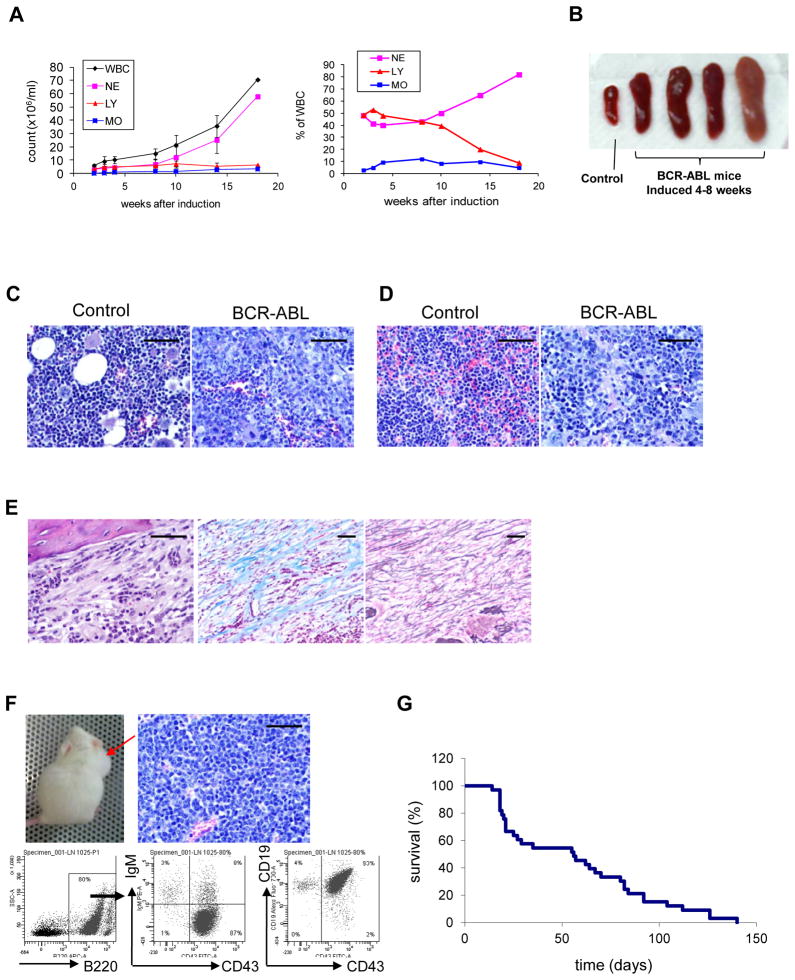
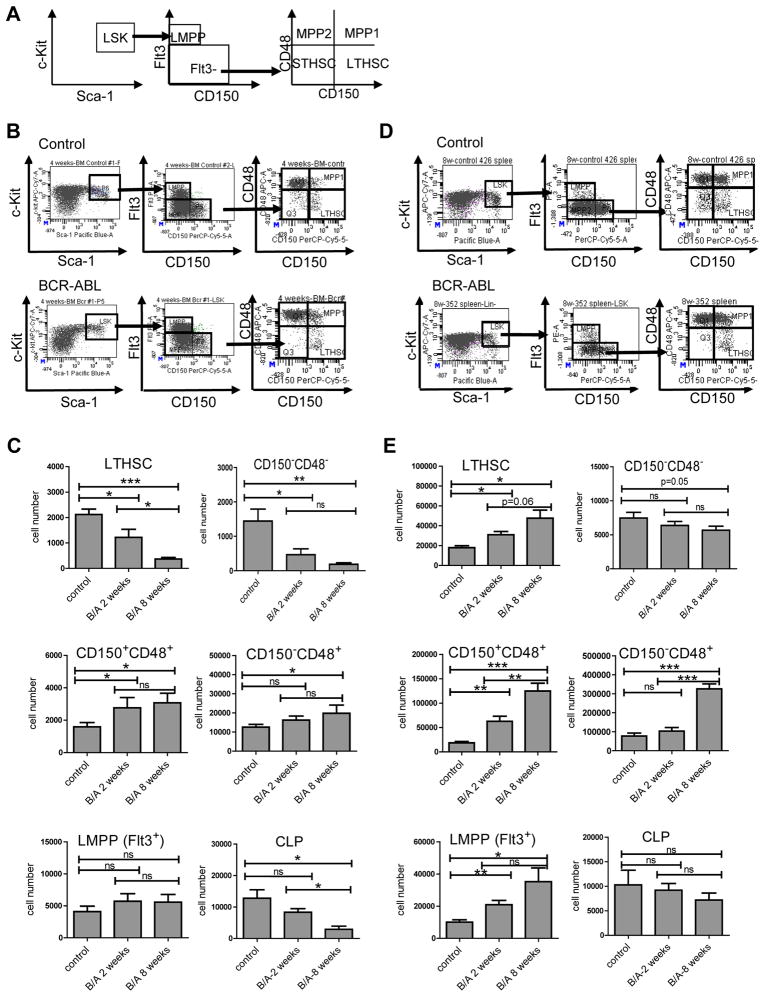
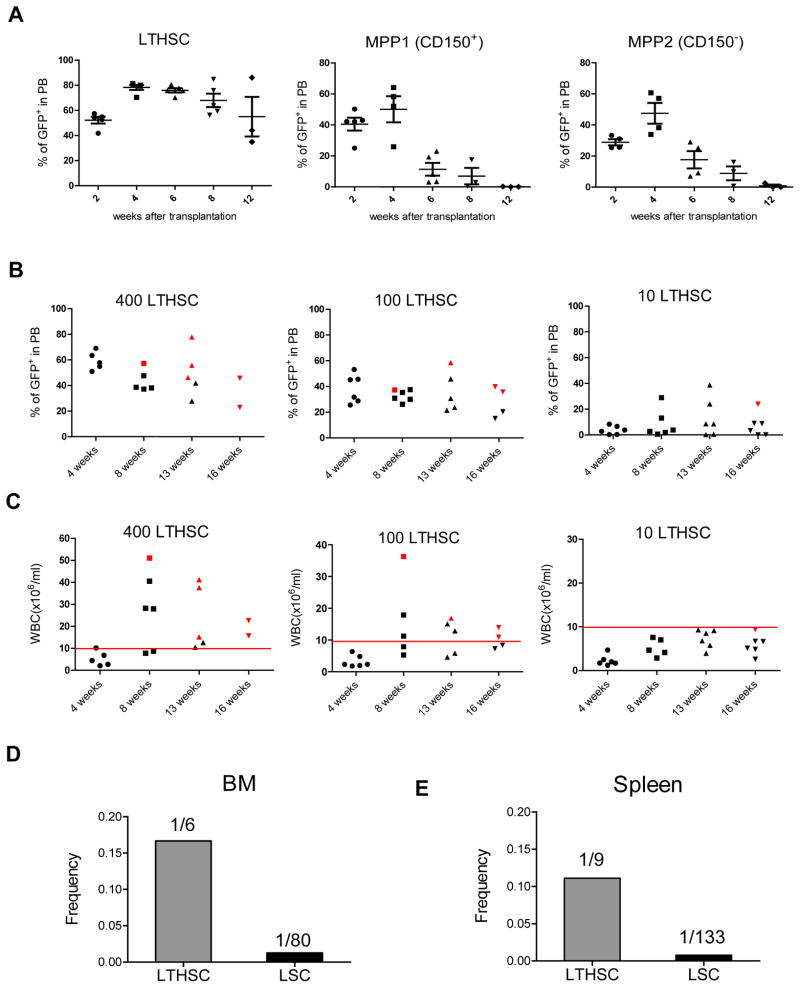
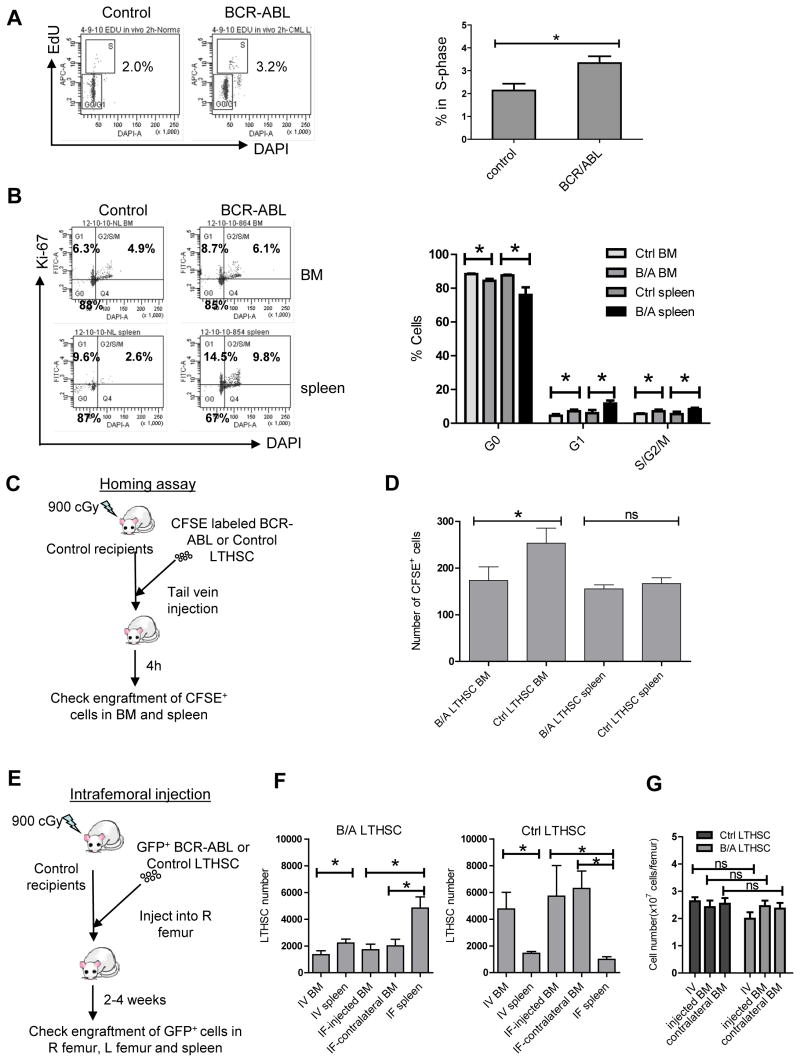
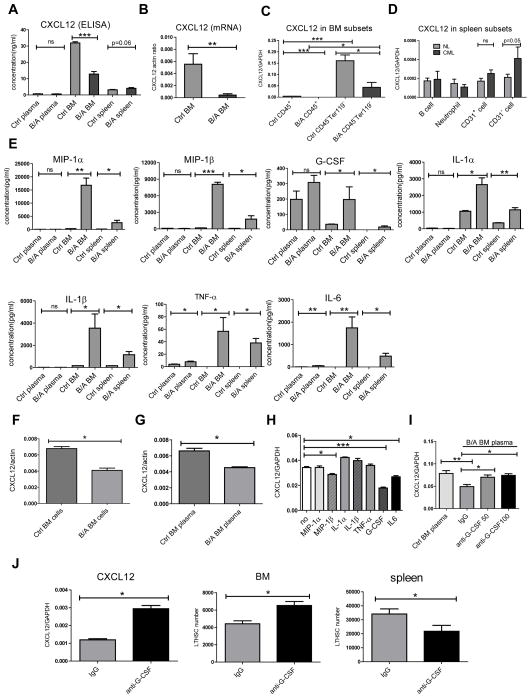
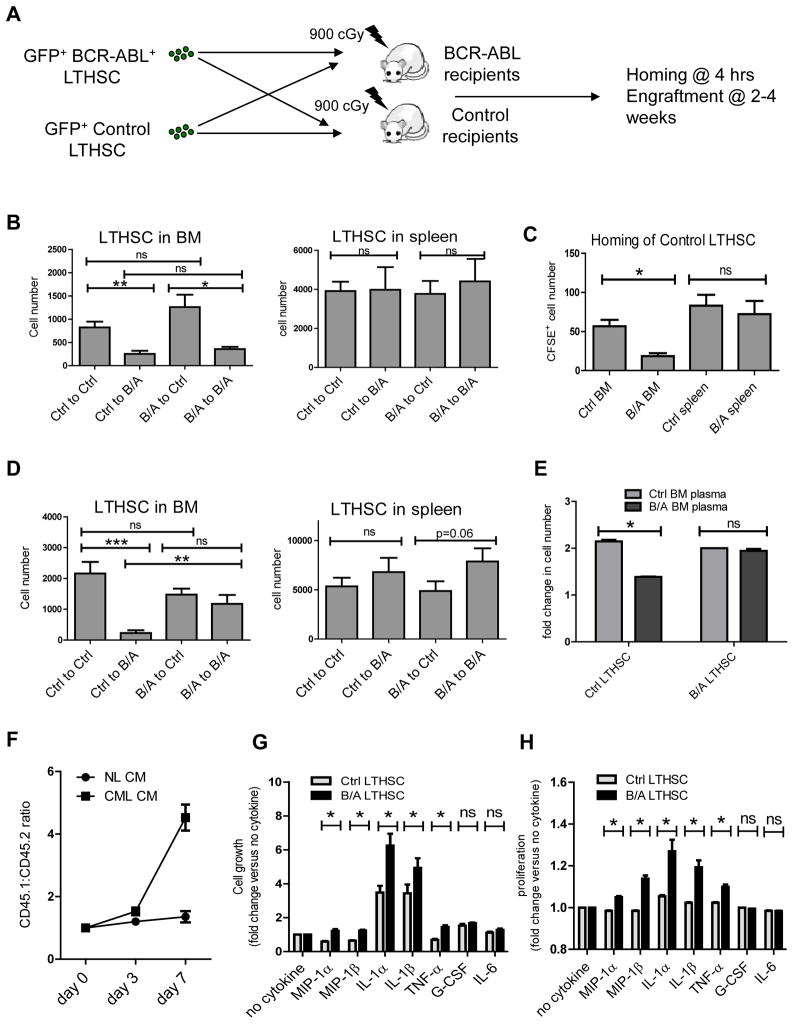
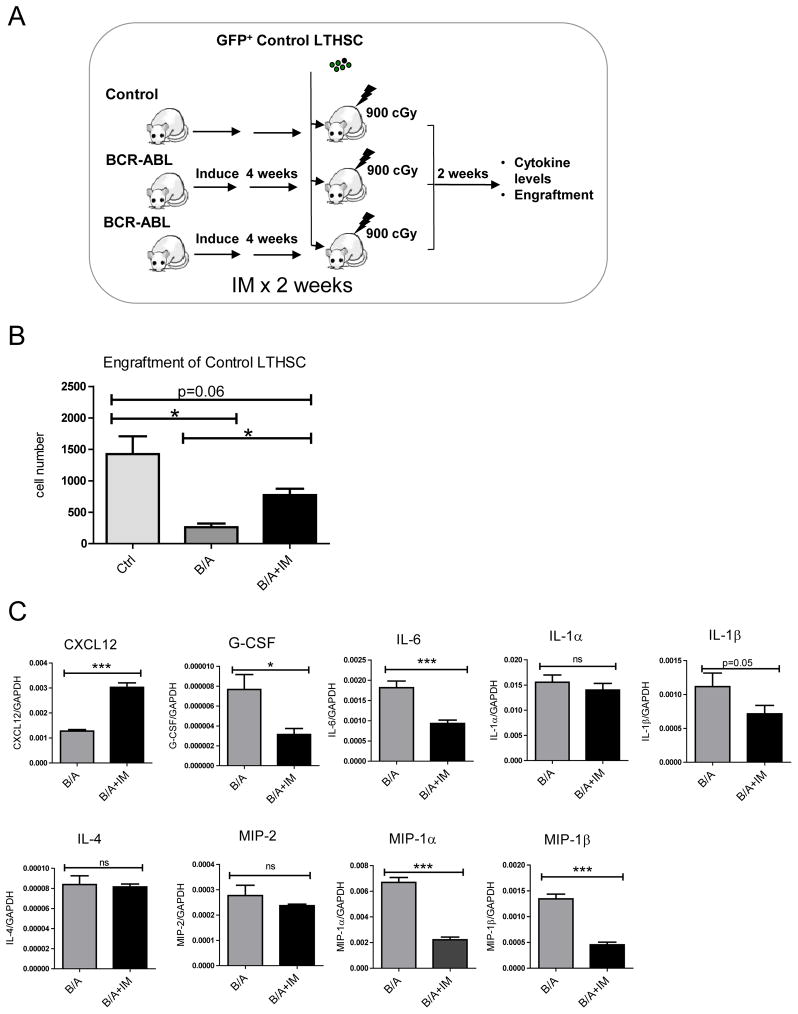
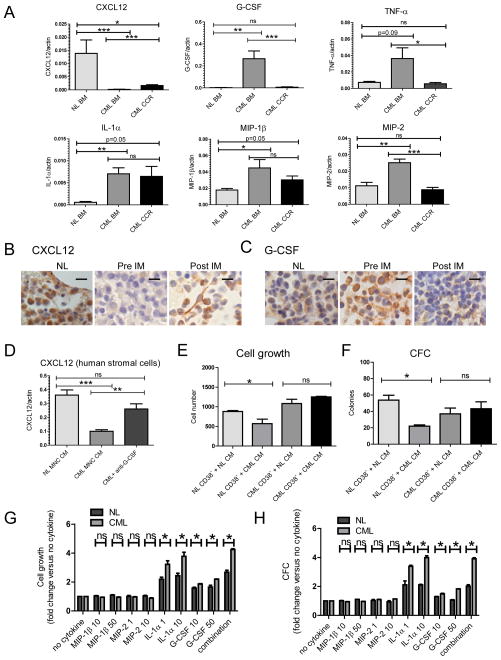
We characterized leukemia stem cells (LSC) in chronic phase chronic myelogenous leukemia (CML) using a transgenic mouse model. LSC were restricted to cells with long-term hematopoietic stem cell (LTHSC) phenotype. CML LTHSC demonstrated reduced homing and retention in the bone marrow (BM), related to decreased CXCL12 expression in CML BM, resulting from increased G-CSF production by leukemia cells. Altered cytokine expression in CML BM was associated with selective impairment of normal LTHSC growth and a growth advantage to CML LTHSC. Imatinib (IM) treatment partially corrected abnormalities in cytokine levels and LTHSC growth. These results were validated using human CML samples and provide improved understanding of microenvironmental regulation of normal and leukemic LTHSC and their response to IM in CML.


Figures

Figure 1
Figure 1. Development of CML-like myeloproliferative disorder in SCL-tTA/BCR-ABL transgenic mice
Development of a myeloproliferative disorder in SCL-tTA/BCR-ABL transgenic mice within 4–6 weeks after induction of BCR-ABL expression by withdrawal of tetracycline, characterized by (A) neutrophilic leukocytosis and (B) splenomegaly (n=20). Histopathological evaluation of (C) BM and (D) spleen tissue obtained 4 weeks after induction of BCR-ABL expression showing leukocytic infiltration. (E) Development of BM fibrosis 10 weeks after induction of BCR-ABL expression as seen with H & E (left), Trichrome (center), and reticulin (right) staining. (F) Development of pro-B lymphoblastic leukemia/lymphoma with lymph node enlargement (upper left panel), lymphoblastic infiltration of lymph nodes (upper right panel), and expression of pro-B cell markers on flow cytometry (lower panel). (G) Survival curve of SCL-tTA/BCR-ABL mice after BCR-ABL induction (n=33). All scale bars represent a size of 100μm.
Figure 2
Figure 2. Changes in stem and progenitor cell populations in BCR-ABL expressing mice
The populations analyzed are shown in (A) and included LinSca-1+c-Kit+ (LSK) cells which were further subdivided into Flt3CD150+CD48 (LTHSC); Flt3CD150CD48, Flt3CD150+CD48+ and Flt3CD150CD48+ (MPP); and Flt3+CD150 cells (LMPP). (B) Representative flow cytometry plots of LTHSC, MPP and LMPP populations in the BM of control and BCR-ABL expressing mice. (C) Total numbers of LTHSC, CD150CD48, CD150+CD48, CD150CD48+ MPP, LMPP, and CLP (common lymphoid progenitor, LinSca-1Lowc-KitLowFlt3HighIL-7RαHigh) in the BM (per femur) of control and SCL-tTA/BCR-ABL mice at 2 and 8 weeks after BCR-ABL induction (n=6–8). (D) Representative flow cytometry plots of LTHSC, MPP and LMPP in the spleen of control mice and BCR-ABL expressing mice. (E) Total numbers of LTHSC, CD150CD48, CD150+CD48, CD150CD48+ MPP, LMPP, and CLP in the spleen of control mice and SCL-tTA/BCR-ABL mice at 2 and 8 weeks after BCR-ABL induction. Results represent mean±SEM. Significance values: *, p<0.05; **, p<0.01; ***, p<0.001; ns, not significant, n=6–8. See also Figure S1.
Figure 3
Figure 3. Long-term engraftment and leukemia induction by BCR-ABL expressing LTHSC
(A) Levels of donor GFP+ cells in peripheral blood after transplantation of BCR-ABL expressing LTHSC (500 cells/mouse), MPP1 (CD150+CD48) (2,000 cells/mouse), and MPP2 (CD150CD48+) (2,000 cells/mouse) into irradiated recipients. Mice were followed for 16 weeks. The mean±SEM are shown. (B) Engraftment of GFP+ cells in peripheral blood, and (C) peripheral blood WBC counts in recipient mice after transplantation of BCR-ABL-expressing LTHSC in limiting dilutions. Red spots indicate mice that died of leukemia within 20 weeks. The calculated frequency of functional long-term engrafting and leukemia-initiating cells within cells with LTHSC (LinSca-1+Kit+Flt3CD150+CD48) phenotype in the (D) BM, and (E) spleen of BCR-ABL mice is shown. The 95% confidence interval for LTHSC and LSC in the BM is 1/15-1/2 and 1/198-1/34 respectively. The 95% confidence interval for LTHSC and LSC in the spleen is 1/21-1/4 and 1/286-1/62 respectively. See also Figure S2.
Figure 4
Figure 4. Alterations in cell cycle, homing and trafficking of BCR-ABL expressing LTHSC
(A) Percentage of cycling LTHSC in the BM of BCR-ABL and control mice evaluated 2 hours after in vivo administration of EdU. Representative flow cytometry plots (left) and combined results (right) are shown (n=3). (B) The proportion of LTHSC from the BM and spleen of BCR-ABL and control mice in G0, G1 and S/G2/M phase evaluated by labeling with Ki-67 and DAPI. Representative flow cytometry plots (left) and combined results (right) are shown (n=3). (C) CFSE-labeled LTHSC were transplanted by tail vein injection into irradiated congenic recipient mice and the number of CFSE expressing cells in the BM and spleen of recipient mice were evaluated 4h after injection. (D) Homing of BCR-ABL and control LTHSC to the marrow and spleen of recipient mice after IV injection is shown (n=8). (E) GFP+ BCR-ABL or control LTHSC (1,000 cells/mouse) were injected directly into the right femur of irradiated congenic mice. Donor GFP+ LTHSC numbers in the injected femur; contralateral femur and spleen were analyzed 2 weeks and 4 weeks after transplantation. (F) Mice receiving control and BCR-ABL+ LTHSC administered intrafemorally or IV were analyzed after 4 weeks (n=8 for both). The number of donor GFP+ LTHSC in the injected femur, contralateral femur and the spleen were analyzed following intra-femoral transplantation, and the number of LTHSC per femur and in the spleen were analyzed following IV transplantation. (G) The BM cellularity at 4 weeks after transplantation is shown. Results represent mean±SEM. Significance values: *, p<0.05; ns, not significant, compared with controls, or as indicated. See also Figure S3.
Figure 5
Figure 5. Altered chemokine and cytokine expression in BCR-ABL mice
(A) CXCL12 levels measured by ELISA in peripheral blood and BM plasma and spleen supernatants from control and BCR-ABL mice. CXCL12 mRNA levels measured by Q-RT-PCR in (B) total BM cells, (C) BM hematopoietic cells (CD45+) and BM stromal cells (CD45Ter119), and (D) splenic B cells (CD45+B220+), neutrophils (CD45+Gr-1+), endothelial cells (CD45Ter119CD31+) and non-endothelial stromal cells (CD45Ter119CD31) cells, from control and BCR-ABL mice. (E) Expression of cytokines and chemokines in peripheral blood and BM plasma, and spleen supernatants, from BCR-ABL-expressing and control mice measured by ELISA using Luminex xMAP technology. CXCL12 mRNA levels in M2-10B4 murine stromal cells co-cultured for 48 hours with (F) BM cells, and (G) BM plasma from BCR-ABL and control mice. (H) CXCL12 mRNA levels in M2-10B4 murine stromal cells cultured for 24 hours in serum-free medium without addition of cytokines, or with MIP-1α (16ng/ml), MIP-1β (8ng/ml), IL-1α (2.5ng/ml), IL-1β (3.5ng/ml), TNF-α (0.05ng/ml), G-CSF (0.2ng/ml) or IL-6 (2ng/ml). (I) CXCL12 mRNA levels in M2-10B4 murine stromal cells following culture for 24 hours with BM plasma from control and BCR-ABL mice together with a function blocking anti-mouse G-CSF antibody (50ng/ml and 100ng/ml) or isotype control antibody. (J) BCR-ABL mice were induced for one week and then were treated with function blocking anti-mouse G-CSF antibody (10μg/mouse, IV, once per day) or isotype control antibody for an additional two weeks. CXCL12 mRNA levels in the BM and the numbers of LTHSC cells in the BM and spleen were measured. Results represent mean±SEM. Significance values: *, p<0.05; **, p<0.01; ***, p<0.001; ns, not significant. See also Figure S4.
Figure 6
Figure 6. Differential regulation of normal and leukemic LTHSC growth by the CML BM microenvironment
(A) GFP+ LTHSC (1,000 cells/mouse) from control or BCR-ABL mice were transplanted into irradiated BCR-ABL or control mice by tail vein injection (n=16 for each group, with a total of 64 mice at 2 weeks and 64 mice at 4 weeks). (B) The numbers of GFP+ LTHSC in the BM and spleen of irradiated control and BCR-ABL recipient mice at 2 weeks post-transplant. (C) Homing of CFSE-labeled control LTHSC transplanted by tail vein injection into irradiated control and BCR-ABL recipient mice evaluated 4 hours after injection. (n=8). (D) The numbers of GFP+ LTHSC in the BM and spleen of irradiated control and BCR-ABL recipient mice at 4 weeks post-transplant. (E) Control LTHSC and BCR-ABL+ LTHSC were cultured with BM plasma obtained from control and BCR-ABL mice. Results shown represent fold-change in cell numbers after 2 days of culture (n=3). (F) BCR-ABL+ LTHSC (CD45.1) and control LTHSC (CD45.2) were mixed in a 1:1 ratio and cultured with CML or control BM conditioned medium (CM). The proportion of input cells was checked using flow cytometry. The ratio of CD45.1:CD45.2 cells at different times is shown (n=3). CFSE+ LTHSC from control and BCR-ABL-expressing mice were cultured with serum-free medium without cytokine or supplemented with MIP-1α (16ng/ml), MIP-1β (8ng/ml), IL-1α (2.5ng/ml), IL-1β (3.5ng/ml), TNF-α (0.05ng/ml), G-CSF (0.2ng/ml) or IL-6 (2ng/ml) for 72 hours and cell growth (G) and proliferation (H) were measured. Results represent mean±SEM. Significance values: *, p<0.05; **, p<0.01; ***, p<0.001; ns, not significant. See also Figure S5.
Figure 7
Figure 7. Effect of IM treatment on cytokine levels on CML BM microenvironmental function
(A)1,000 GFP+ control LTHSC/mouse were sorted and transplanted into irradiated control mice, BCR-ABL mice (induced 4 weeks) and BCR-ABL mice treated with IM for the last 2 weeks of the induction period (n=8 each). (B) Engraftment of control LTHSC in the BM of irradiated control, BCR-ABL and IM-treated BCR-ABL mice. (C) Cytokine and chemokine mRNA levels in the BM of BCR-ABL mice treated with or without IM were measured. Results represent mean±SEM. Significance values: *, p<0.05; **, p<0.01, n=8.
Figure 8
Figure 8. Cytokine and chemokine expression in human CML BM cells
(A) Cytokine and chemokine mRNA levels in BM MNC from control, newly diagnosed CML CP patients and CML CP patients in complete cytogenetic remission (CCR) on IM treatment were measured by Q-RT-PCR, and results normalized to actin expression. (B) CXCL12 and (C) G-CSF expression in BM sections obtained from untreated lymphoma patients without BM involvement by disease (NL), newly diagnosed CML CP patients prior to starting IM treatment (pre-IM) and from the same patients after 6 months or more of IM treatment (Post-IM) were analyzed by Immunohistochemistry (n=3). Scale bars represent a size of 10μm. (D) Primary human stromal cells immortalized with hTERT expression were exposed to CM made with BM MNC from healthy controls and CML CP patients for 24 hours. The effect of addition of a blocking anti-human G-CSF (10ug/ml) antibody or isotype control antibody on CXCL12 mRNA levels was evaluated. (E) CD34+CD38 cells from control and newly diagnosed CML CP patients were cultured for 48 hours with CM made with BM MNC from healthy controls and newly diagnosed CML CP patients and cell growth measured using a luminescent cell viability assay and (F) in CFC assays. CD34+ cells from normal and newly diagnosed CML CP patients were labeled with CFSE, and CFSE+ LinCD34+CD38 cells were sorted and cultured for 72 hours in serum-free medium either without cytokines, or supplemented with MIP-1β (10 and 50ng/ml), MIP-2 (1 and 10ng/ml), IL-1α (1 and 10ng/ml), G-CSF (10 and 50ng/ml) or the combination (10ng/ml MIP-1β, 1ng/ml MIP2, 1ng/ml IL-1α, 50ng/ml G-CSF). Cell growth was measured using a (G) luminescent viability assay and (H) in CFC assay. Results represent mean±SEM. Significance values: *, p<0.05; **, p<0.01; ***, p<0.001; ns, not significant. See also Figure S6.

References

    1. Akala OO, Park IK, Qian D, Pihalja M, Becker MW, Clarke MF. Long-term haematopoietic reconstitution by Trp53−/−p16Ink4a−/−p19Arf−/− multipotent progenitors. Nature. 2008;453:228–232. - PubMed
    1. Bhatia R, McGlave PB, Dewald GW, Blazar BR, Verfaillie CM. Abnormal function of the bone marrow microenvironment in chronic myelogenous leukemia: role of malignant stromal macrophages. Blood. 1995;85:3636–3645. - PubMed
    1. Bonig H, Priestley GV, Papayannopoulou T. Hierarchy of molecular-pathway usage in bone marrow homing and its shift by cytokines. Blood. 2006;107:79–86. - PMC - PubMed
    1. Cappella P, Gasparri F, Pulici M, Moll J. Cell proliferation method: click chemistry based on BrdU coupling for multiplex antibody staining. In: Paul Robinson J, editor. Current protocols in cytometry/editorial board. Unit7. Chapter 7. 2008. p. 34. - PubMed
    1. Cashman J, Clark-Lewis I, Eaves A, Eaves C. Stromal-derived factor 1 inhibits the cycling of very primitive human hematopoietic cells in vitro and in NOD/SCID mice. Blood. 2002;99:792–799. - PubMed

Publication types

MeSH terms