. 2012;5(1):26-44.
doi: 10.1159/000335319. Epub 2012 Apr 20.

High-amylose resistant starch increases hormones and improves structure and function of the gastrointestinal tract: a microarray study

Affiliations

High-amylose resistant starch increases hormones and improves structure and function of the gastrointestinal tract: a microarray study

Michael J Keenan et al. J Nutrigenet Nutrigenomics. 2012.

Abstract

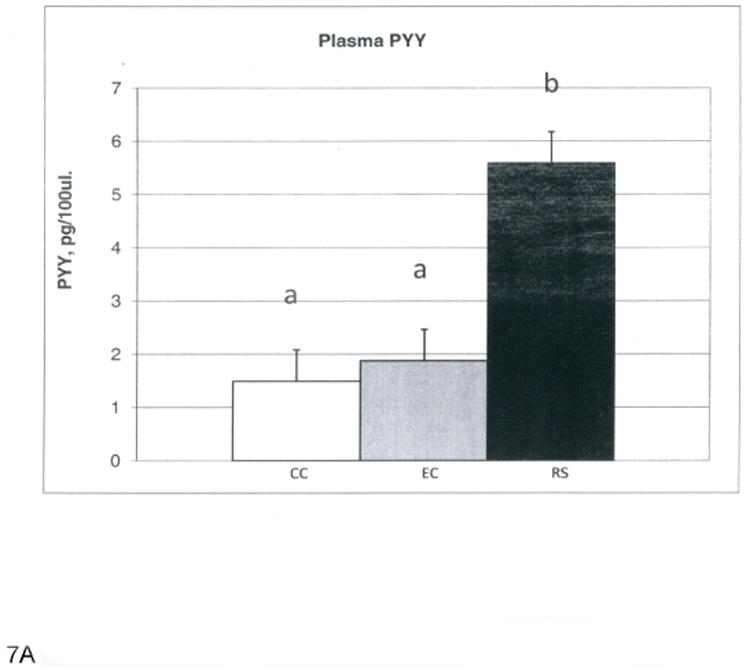
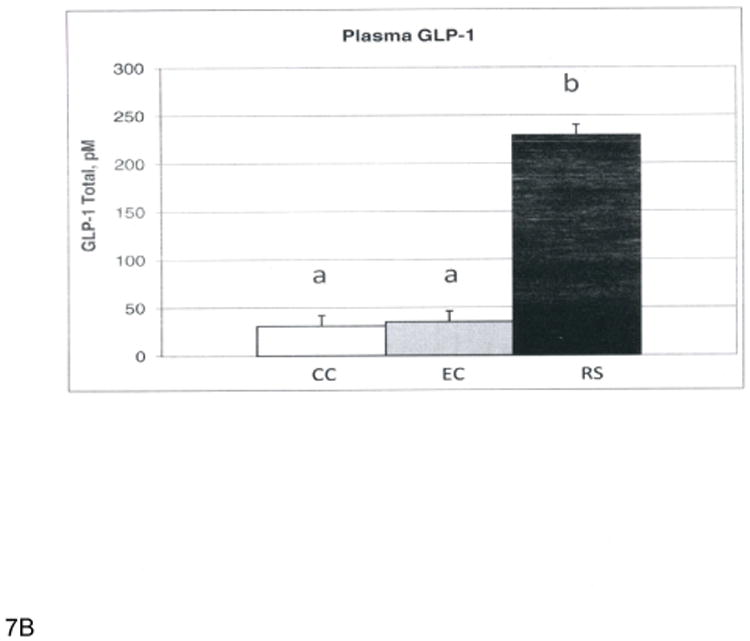
Background/aims: Type 2 resistant starch from high-amylose maize (HAM-RS2) is associated with increased fermentation, increased expression of proglucagon (gene for GLP-1) and peptide YY (PYY) genes in the large intestine, and improved health. To determine what other genes are up- or downregulated with feeding of HAM-RS2, a microarray was performed.

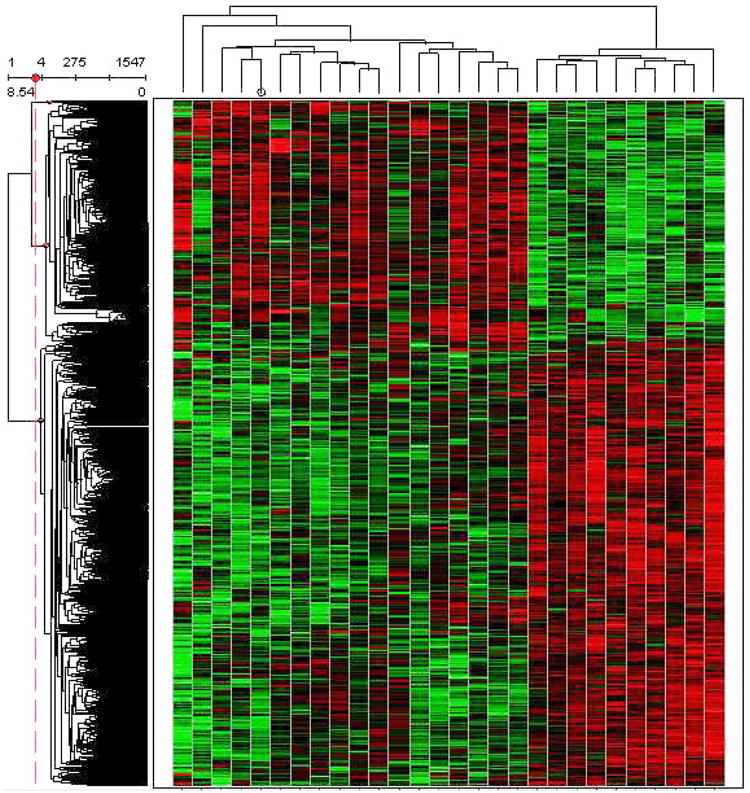
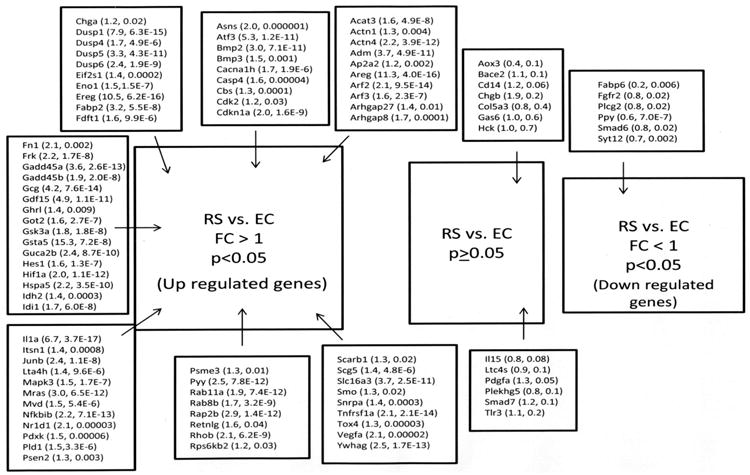
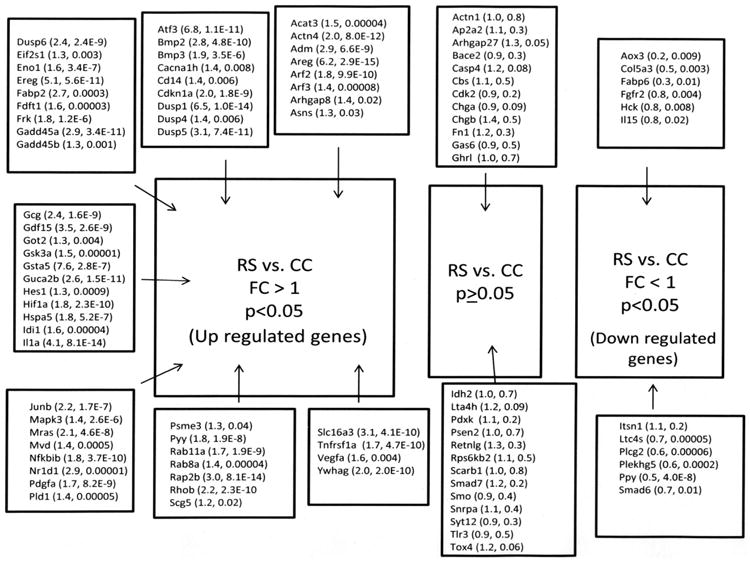
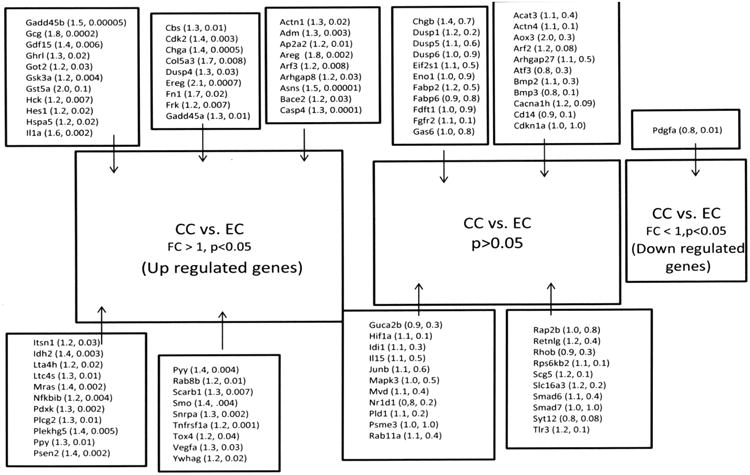
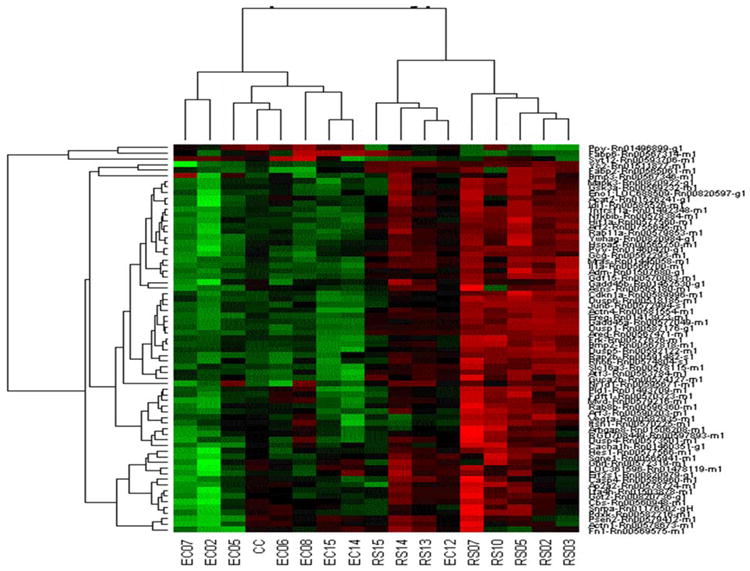
Methods: Adult, male Sprague Dawley rats were fed one of the following three diets for a 4-week study period: cornstarch control (CC, 3.74 kcal/g), dietary energy density control (EC, 3.27 kcal/g), and 30% HAM-RS2 (RS, 3.27 kcal/g). Rat microarray with ∼27,000 genes and validation of 94 representative genes with multiple qPCR were used to determine gene expression in total RNA extracts of cecal cells from rats. The RS versus EC comparison tested effects of fermentation as energy density of the diet was controlled.

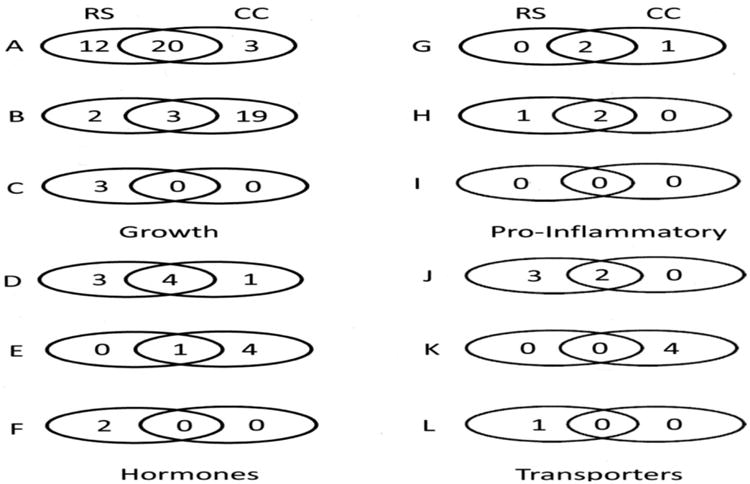
Results: For the RS versus EC comparison, 86% of the genes were validated from the microarray and the expression indicates promotion of cell growth, proliferation, differentiation, and apoptosis. Gut hormones GLP-1 and PYY were increased.

Conclusions: Gene expression results predict improved structure and function of the GI tract. Production of gut hormones may promote healthy functions beyond the GI tract.


Figures

Figure 1
Figure 1
A hierarchical cluster of the Z scores of the microarray signals for RS, CC and EC groups for genes that were significantly different at p<0.01. This visualization shows data in a dendrogram (a tree graph) based on the similarity between treatment replicates. The Z-scores were determined by calculating the three groups combined mean for each gene, and then individual differences of treatment replicates from the mean were divided by the standard deviation. This is one type of normalization for making gene-gene comparisons. Different genes are shown in each separate row. The columns are individual replicates of treatments and from left to right they are: EC3, CC3, CC14, CC2, CC8, CC12, CC4, CC15, EC15, EC13, EC12, EC6, CC7, EC5, EC2, CC6, EC9, EC7, RS3, RS9, RS15, RS8, RS13, RS4, RS12, RS14, RS7, RS5.
Figure 2
Figure 2
Results of validation for the RS vs. EC comparison. Genes are identified by their abbreviation. In parentheses are the (fold change, p value). Names of genes and their abbreviations are listed in tables 3 through 5.
Figure 3
Figure 3
Results of validation for the RS vs. CC comparison. Genes are identified by their abbreviation. In parentheses are the (fold change, p value). Names of genes and their abbreviations are listed in tables 3 through 5.
Figure 4
Figure 4
Results of validation for the CC vs. EC comparison. Genes are identified by their abbreviation. In parentheses are the (fold change, p value). Names of genes and their abbreviations are listed in tables 3 through 5.
Figure 5
Figure 5
Venn diagrams comparing RS and CC gene expression grouped according to four broad categories of function. The figure compares RS vs. EC with RS vs. EC for similarities and differences in numbers of genes that were either up-regulated (A, D, G, J), not different (B, E, H, K), or down- regulated (C, F, I, L). The four broad categories are 1. growth and differentiation, regulators of cell cycle, and angiogenesis; 2. Hormones and secretory proteins; 3. pro-inflammatory; and 4. Transporters.
Figure 6
Figure 6
A hierarchical cluster of the Z scores of the antilogs of the 2-ΔΔCT of RS vs. EC from the TaqMan Custom Array panel results from the validation. The Z-scores were determined by calculating the three groups combined mean for each gene, and then individual differences of treatment replicates from the mean were divided by the standard deviation. This is one type of normalization for making gene-gene comparisons. Different genes are shown in each separate row. The columns are individual replicates of treatments and from left to right they are: EC7, EC12, EC5, mean of CC group, EC6, EC8, EC15, EC14, RS15, RS14, RS13, EC12, RS7, RS10, RS5, RS2, RS3.
Figure 7
Figure 7
A. Plasma PYY levels (pg/100μl). B. Plasma GLP-1 levels (pM). Bars with different superscripts are statistically different at p<0.0001.
Figure 7
Figure 7
A. Plasma PYY levels (pg/100μl). B. Plasma GLP-1 levels (pM). Bars with different superscripts are statistically different at p<0.0001.

References

    1. Brown IL. Applications and uses of resistant starch. J AOAC Int. 2004;87:727–732. - PubMed
    1. Cassidy A, Bingham SA, Cummings JH. Starch intake and colorectal cancer risk: an international comparison. Br J Cancer. 1994;69:937–942. - PMC - PubMed
    1. de Deckere EA, Kloots WJ, van Amelsvoort JM. Resistant starch decreases serum total cholesterol and triacylglycerol concentrations in rats. J Nutr. 1993;123:2142–2151. - PubMed
    1. Higgins JA. Resistant starch: metabolic effects and potential health benefits. J AOAC Int. 2004;87:761–768. - PubMed
    1. Keenan MJ, Zhou J, McCutcheon KL, Raggio AM, Bateman HG, Todd E, Jones CK, Tulley RT, Melton S, Martin RJ, Hegsted M. Effects of resistant starch, a non-digestible fermentable fiber, on reducing body fat. Obesity (Silver Spring) 2006;14:1523–1534. - PubMed

Publication types