

Joint latent class models for longitudinal and time-to-event data: a review
- PMID: 22517270
- PMCID: PMC5863083
- DOI: 10.1177/0962280212445839
Joint latent class models for longitudinal and time-to-event data: a review
Abstract
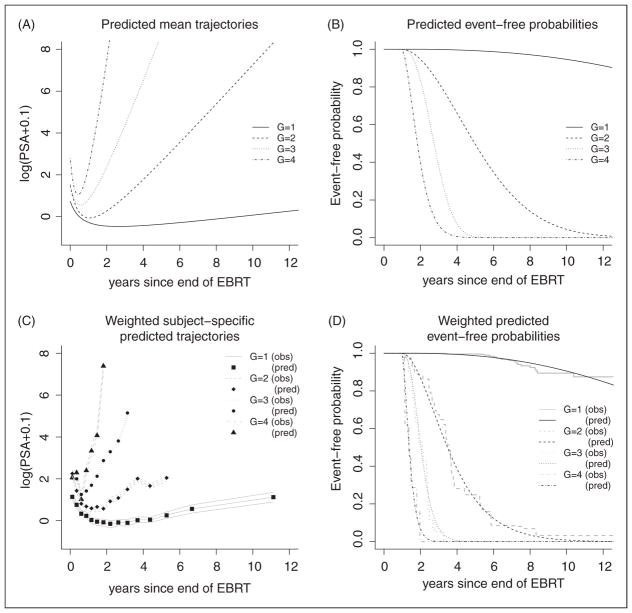
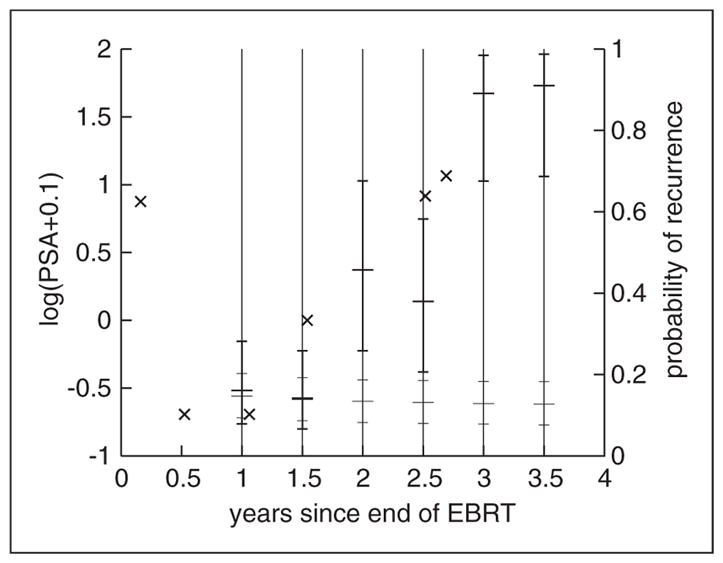
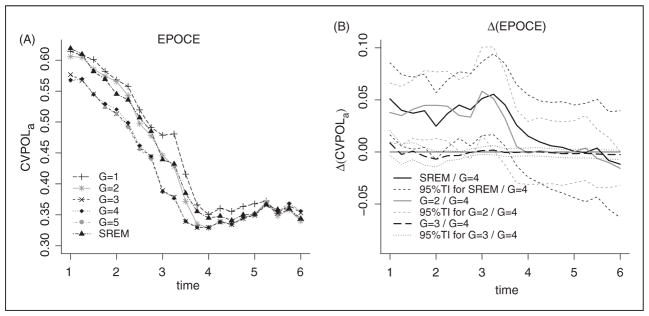
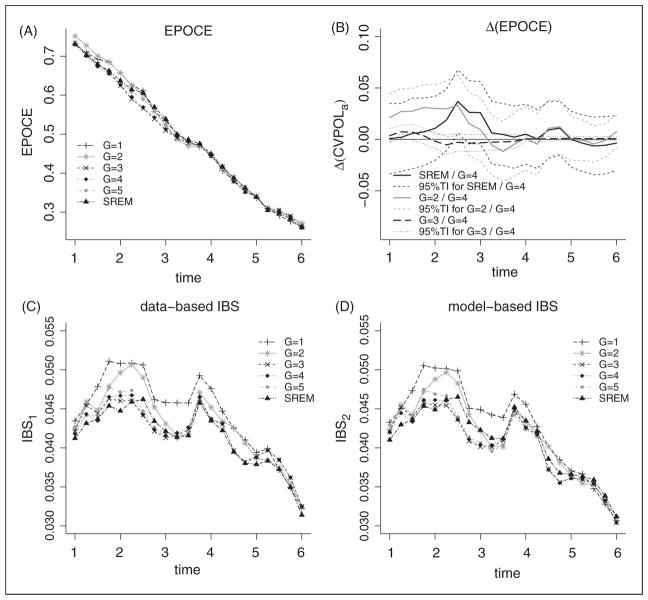
Most statistical developments in the joint modelling area have focused on the shared random-effect models that include characteristics of the longitudinal marker as predictors in the model for the time-to-event. A less well-known approach is the joint latent class model which consists in assuming that a latent class structure entirely captures the correlation between the longitudinal marker trajectory and the risk of the event. Owing to its flexibility in modelling the dependency between the longitudinal marker and the event time, as well as its ability to include covariates, the joint latent class model may be particularly suited for prediction problems. This article aims at giving an overview of joint latent class modelling, especially in the prediction context. The authors introduce the model, discuss estimation and goodness-of-fit, and compare it with the shared random-effect model. Then, dynamic predictive tools derived from joint latent class models, as well as measures to evaluate their dynamic predictive accuracy, are presented. A detailed illustration of the methods is given in the context of the prediction of prostate cancer recurrence after radiation therapy based on repeated measures of Prostate Specific Antigen.
Keywords: Brier score; joint model; longitudinal data; mixture model; predictive accuracy; prognosis; prostate cancer.
Figures
References
-
- Wulfsohn MS, Tsiatis AA. A joint model for survival and longitudinal data measured with error. Biometrics. 1997;53(1):330–339. - PubMed
-
- Yu M, Taylor JMG, Sandler HM. Individual prediction in prostate cancer studies using a joint longitudinal survival-cure model. J Am Stat Assoc. 2008;103:178–187.
-
- Prentice RL. Covariate measurement errors and parameter estimation in cox’s failure time regression model. Biometrika. 1982;69(2):331–342.
-
- Taylor JMG, Yu M, Sandler HM. Individualized predictions of disease progression following radiation therapy for prostate cancer. J Clin Oncol. 2005;23(4):816–825. - PubMed
Publication types
MeSH terms
Substances
Grants and funding
LinkOut - more resources
Full Text Sources
