. 2013 Mar;14(2):178-92.
doi: 10.1093/bib/bbs017. Epub 2012 Apr 19.

Integrative Genomics Viewer (IGV): high-performance genomics data visualization and exploration

Affiliations

Integrative Genomics Viewer (IGV): high-performance genomics data visualization and exploration

Helga Thorvaldsdóttir et al. Brief Bioinform. 2013 Mar.

Abstract

Data visualization is an essential component of genomic data analysis. However, the size and diversity of the data sets produced by today's sequencing and array-based profiling methods present major challenges to visualization tools. The Integrative Genomics Viewer (IGV) is a high-performance viewer that efficiently handles large heterogeneous data sets, while providing a smooth and intuitive user experience at all levels of genome resolution. A key characteristic of IGV is its focus on the integrative nature of genomic studies, with support for both array-based and next-generation sequencing data, and the integration of clinical and phenotypic data. Although IGV is often used to view genomic data from public sources, its primary emphasis is to support researchers who wish to visualize and explore their own data sets or those from colleagues. To that end, IGV supports flexible loading of local and remote data sets, and is optimized to provide high-performance data visualization and exploration on standard desktop systems. IGV is freely available for download from http://www.broadinstitute.org/igv, under a GNU LGPL open-source license.


Figures

Figure 1:
Figure 1:
IGV class diagram, illustrating the IGV software structure.
Figure 2:
Figure 2:
The IGV application window.
Figure 3:
Figure 3:
The attribute panel displays a color-coded matrix of phenotypic and clinical data. Clicking on a column header will sort the tracks by the corresponding attribute.
Figure 4:
Figure 4:
Read alignment views at 20 kb and base pair resolution. IGV displays varying level of data detail depending on the zoom level, and uses color and transparency to highlight interesting events in the data. (A) Reads are summarized as a coverage plot. Positions with a significant number of mismatches with respect to the reference are highlighted with color bars indicative of both the presence of mismatches and the allele frequency. (B) Individual base mismatches are displayed with alpha transparency proportional to quality. In this example, the reads have been sorted and colored by strand.
Figure 5:
Figure 5:
IGV bisulfite sequencing view. (A) Two views of the IGF2/H19 Imprinting Control Region (ICR), illustrating allele-specific methylation of CTCF binding sites. The top view shows a 13-kb region of ChIP-seq histone marks from the ENCODE normal epithelial tissue (HMEC) cell line. The second view shows WGBS read alignments from normal colonic mucosa [19], zoomed in to 75 bp. CpG dinucleotides are shown as blue (unmethylated) and red (methylated) squares. A heterozygous C/T SNP is also apparent, and the T allele is overwhelmingly associated with reads that have methylated CpGs (from the paternal chromosome). (B) The enhancer region surrounding exons 2 and 3 of the B3GNTL1 gene is apparent from the ENCODE tracks showing characteristic enhancer histone marks in a normal epithelial (HMEC) cell line. The bisulfite sequencing view of the read alignments shows that this enhancer is methylated (red – lighter) in normal colon mucosa, but almost completely unmethylated (blue – darker) in the matched colon tumor sample [19]. The cancer-specific de-methylation of this enhancer is consistent with the upregulation of the B3GNTL1 transcript in the tumor.
Figure 6:
Figure 6:
Visualization of RNA-seq data from heart and liver tissue samples. Each panel includes tracks for total coverage, junction coverage, predicted transcripts and read alignments. Reads that span junctions are connected with thin blue lines. In the junction track, the height of each arc is proportional to the total number of reads spanning the junction. There is clear evidence of alternative splicing between the two tissues.
Figure 7:
Figure 7:
Gene-list view of copy number, mutation and clinical data from 202 glioblastoma samples from the TCGA project. The IGV window has been split into panels corresponding to four genes from the p53 signaling pathway. Copy number is indicated by color, with blue denoting deletion and red amplification. Mutations are overlaid as small black rectangles. The samples have been sorted by copy number of CDKN2A. In this view it is apparent that deletion of CDKN2A and mutation of TP53 tend to be mutually exclusive.
Figure 8:
Figure 8:
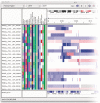
Split-screen view of read alignments from a glioblastoma multiforme tumor sample and matched normal, displaying regions of chromosomes 1 and 6. In this example, alignments whose mate pairs are mapped to unexpected locations are color-coded by the chromosome of the mate; other alignments are displayed in light gray. The brown alignments on the left panel and purple alignments on the right are matepairs, indicating a fusion between these loci. There is no evidence of this rearrangement in the matched normal.

References

    1. Robinson JT, Thorvaldsdottir H, Winckler W, et al. Integrative genomics viewer. Nat Biotechnol. 2011;29:24–6. - PMC - PubMed
    1. Milne I, Bayer M, Cardle L, et al. Tablet—next generation sequence assembly visualization. Bioinformatics. 2010;26:401–2. - PMC - PubMed
    1. Carver T, Bohme U, Otto TD, et al. BamView: viewing mapped read alignment data in the context of the reference sequence. Bioinformatics. 2010;26:676–7. - PMC - PubMed
    1. Fiume M, Williams V, Brook A, et al. Savant: genome browser for high-throughput sequencing data. Bioinformatics. 2010;26:1938–44. - PMC - PubMed
    1. Rutherford K, Parkhill J, Crook J, et al. Artemis: sequence visualization and annotation. Bioinformatics. 2000;16:944–5. - PubMed

Publication types

MeSH terms