

IsoQuant: a software tool for stable isotope labeling by amino acids in cell culture-based mass spectrometry quantitation
- PMID: 22519468
- PMCID: PMC3583527
- DOI: 10.1021/ac300510t
IsoQuant: a software tool for stable isotope labeling by amino acids in cell culture-based mass spectrometry quantitation
Abstract
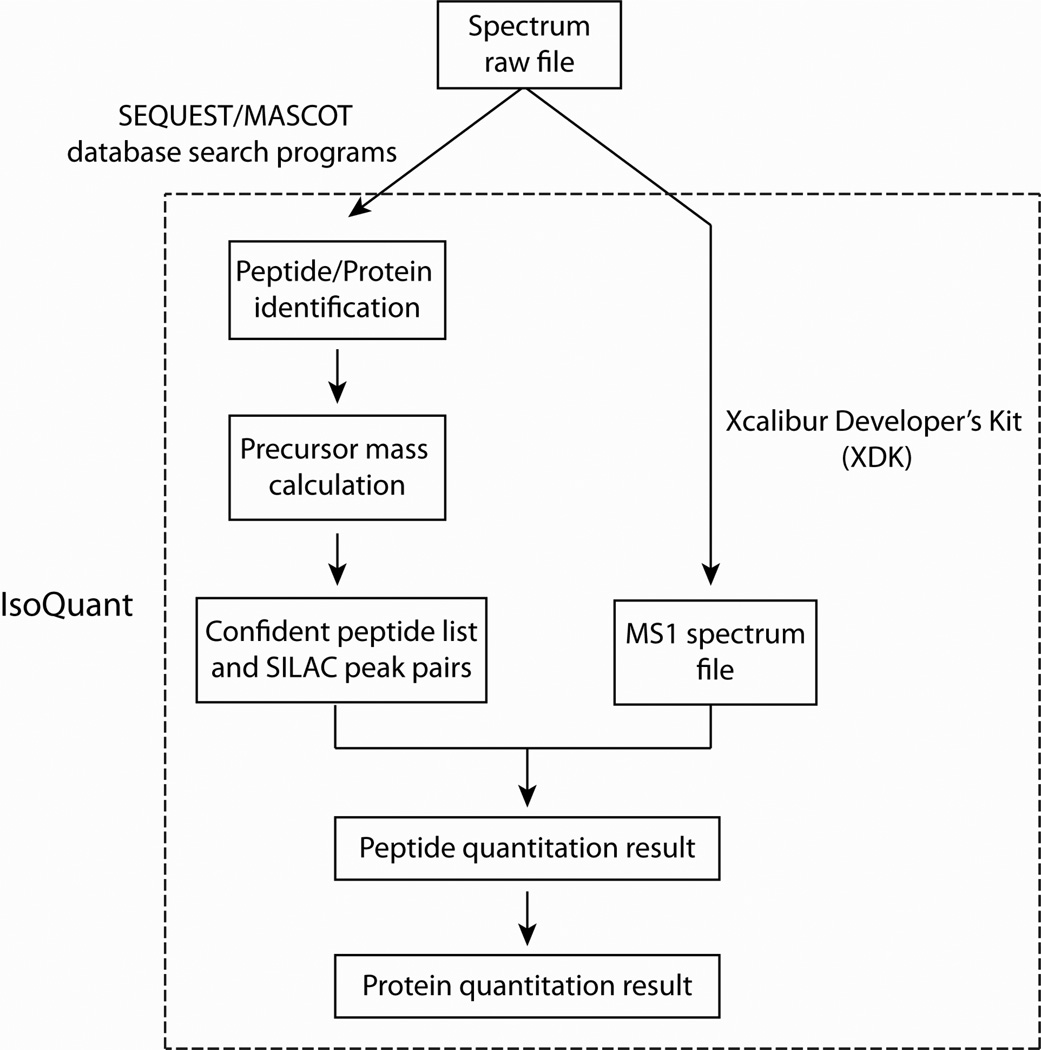
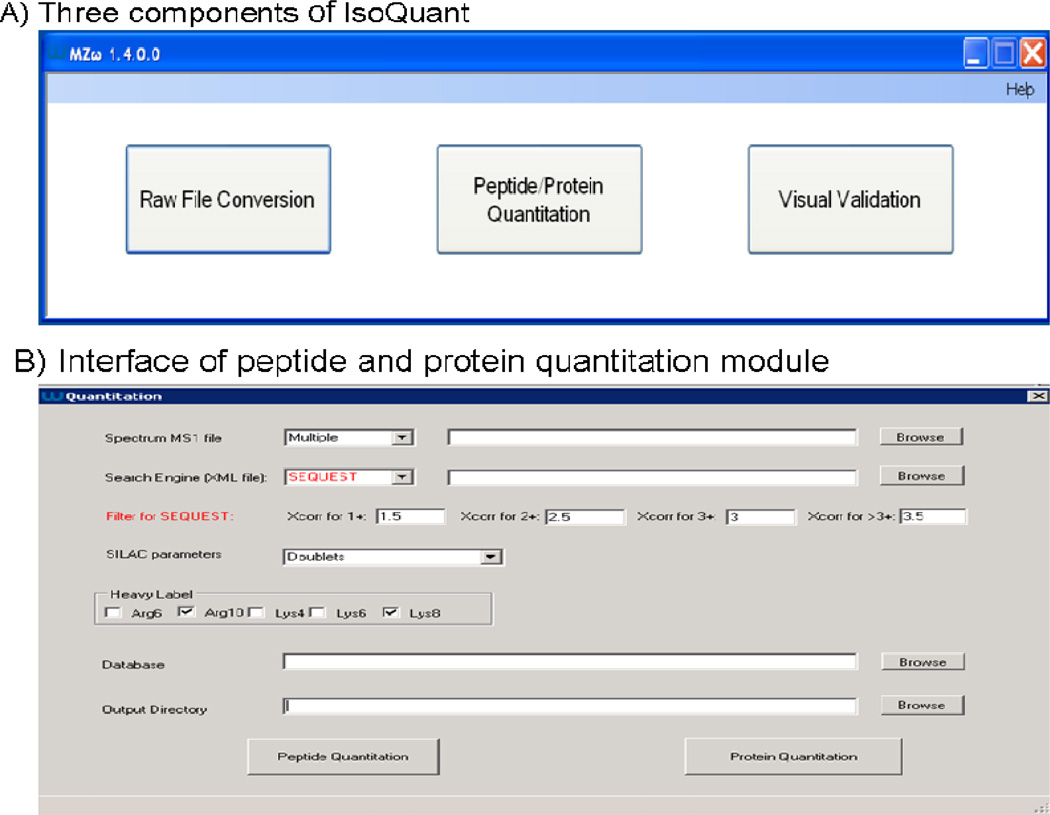
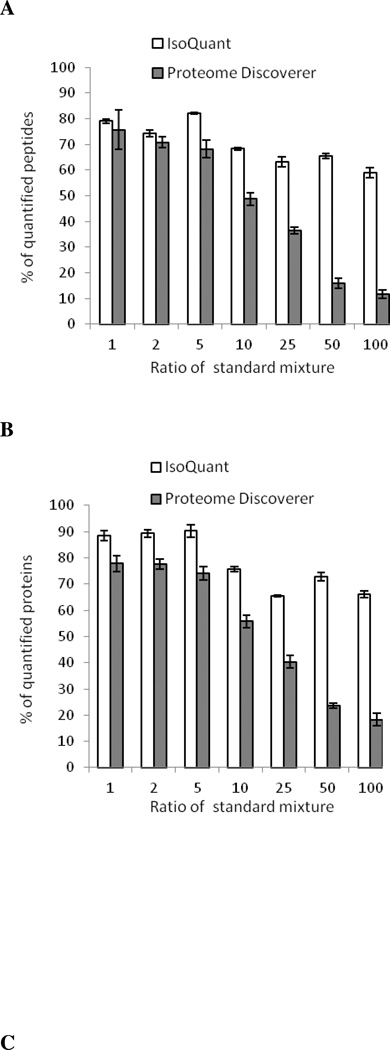
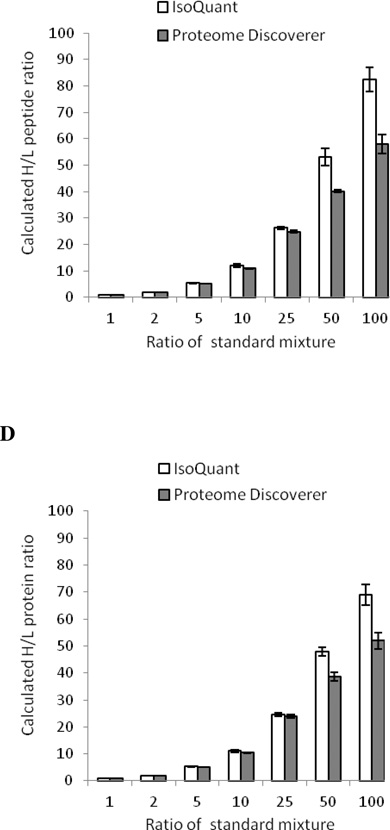
Accurate protein identification and quantitation are critical when interpreting the biological relevance of large-scale shotgun proteomics data sets. Although significant technical advances in peptide and protein identification have been made, accurate quantitation of high-throughput data sets remains a key challenge in mass spectrometry data analysis and is a labor intensive process for many proteomics laboratories. Here, we report a new SILAC-based proteomics quantitation software tool, named IsoQuant, which is used to process high mass accuracy mass spectrometry data. IsoQuant offers a convenient quantitation framework to calculate peptide/protein relative abundance ratios. At the same time, it also includes a visualization platform that permits users to validate the quality of SILAC peptide and protein ratios. The program is written in the C# programming language under the Microsoft .NET framework version 4.0 and has been tested to be compatible with both 32-bit and 64-bit Windows 7. It is freely available to noncommercial users at http://www.proteomeumb.org/MZw.html .
Figures
Similar articles
-
Quantitative analysis of SILAC data sets using spectral counting.Proteomics. 2010 Apr;10(7):1408-15. doi: 10.1002/pmic.200900684. Proteomics. 2010. PMID: 20104619 Free PMC article.
-
Open source libraries and frameworks for mass spectrometry based proteomics: a developer's perspective.Biochim Biophys Acta. 2014 Jan;1844(1 Pt A):63-76. doi: 10.1016/j.bbapap.2013.02.032. Epub 2013 Mar 1. Biochim Biophys Acta. 2014. PMID: 23467006 Free PMC article. Review.
-
Stable Isotope Labeling by Amino Acids in Cell Culture (SILAC) for Quantitative Proteomics.Adv Exp Med Biol. 2019;1140:531-539. doi: 10.1007/978-3-030-15950-4_31. Adv Exp Med Biol. 2019. PMID: 31347069 Review.
-
MaXIC-Q Web: a fully automated web service using statistical and computational methods for protein quantitation based on stable isotope labeling and LC-MS.Nucleic Acids Res. 2009 Jul;37(Web Server issue):W661-9. doi: 10.1093/nar/gkp476. Epub 2009 Jun 15. Nucleic Acids Res. 2009. PMID: 19528069 Free PMC article.
-
Methods and Algorithms for Quantitative Proteomics by Mass Spectrometry.Methods Mol Biol. 2020;2051:161-197. doi: 10.1007/978-1-4939-9744-2_7. Methods Mol Biol. 2020. PMID: 31552629 Review.
Cited by
-
An Internal Standard-Assisted Synthesis and Degradation Proteomic Approach Reveals the Potential Linkage between VPS4B Depletion and Activation of Fatty Acid β-Oxidation in Breast Cancer Cells.Int J Proteomics. 2013;2013:291415. doi: 10.1155/2013/291415. Epub 2013 Feb 4. Int J Proteomics. 2013. PMID: 23431444 Free PMC article.
-
Inferring Protein-Protein Interaction Networks From Mass Spectrometry-Based Proteomic Approaches: A Mini-Review.Comput Struct Biotechnol J. 2019 Jun 20;17:805-811. doi: 10.1016/j.csbj.2019.05.007. eCollection 2019. Comput Struct Biotechnol J. 2019. PMID: 31316724 Free PMC article. Review.
-
Haploinsufficiency of the intellectual disability gene SETD5 disturbs developmental gene expression and cognition.Nat Neurosci. 2018 Dec;21(12):1717-1727. doi: 10.1038/s41593-018-0266-2. Epub 2018 Nov 19. Nat Neurosci. 2018. PMID: 30455454
-
Human DNA Ligase I Interacts with and Is Targeted for Degradation by the DCAF7 Specificity Factor of the Cul4-DDB1 Ubiquitin Ligase Complex.J Biol Chem. 2016 Oct 14;291(42):21893-21902. doi: 10.1074/jbc.M116.746198. Epub 2016 Aug 29. J Biol Chem. 2016. PMID: 27573245 Free PMC article.
-
Exosomal Proteome Profiling: A Potential Multi-Marker Cellular Phenotyping Tool to Characterize Hypoxia-Induced Radiation Resistance in Breast Cancer.Proteomes. 2013 Sep 1;1(2):87-108. doi: 10.3390/proteomes1020087. Proteomes. 2013. PMID: 24860738 Free PMC article.
References
-
- Aebersold R, Mann M. Nature. 2003;422:198–207. - PubMed
-
- Yates JR, 3rd, Eng JK, McCormack AL, Schieltz D. Anal Chem. 1995;67:1426–1436. - PubMed
-
- Perkins DN, Pappin DJ, Creasy DM, Cottrell JS. Electrophoresis. 1999;20:3551–3567. - PubMed
-
- Craig R, Beavis RC. Bioinformatics. 2004;20:1466–1467. - PubMed
-
- Clauser KR, Baker P, Burlingame AL. Anal Chem. 1999;71:2871–2882. - PubMed
Publication types
MeSH terms
Substances
Grants and funding
LinkOut - more resources
Full Text Sources
Other Literature Sources
