. 2012 Apr 19;11(4):375-86.
doi: 10.1016/j.chom.2012.02.008.

C. elegans detects pathogen-induced translational inhibition to activate immune signaling

Affiliations

C. elegans detects pathogen-induced translational inhibition to activate immune signaling

Tiffany L Dunbar et al. Cell Host Microbe. .

Abstract

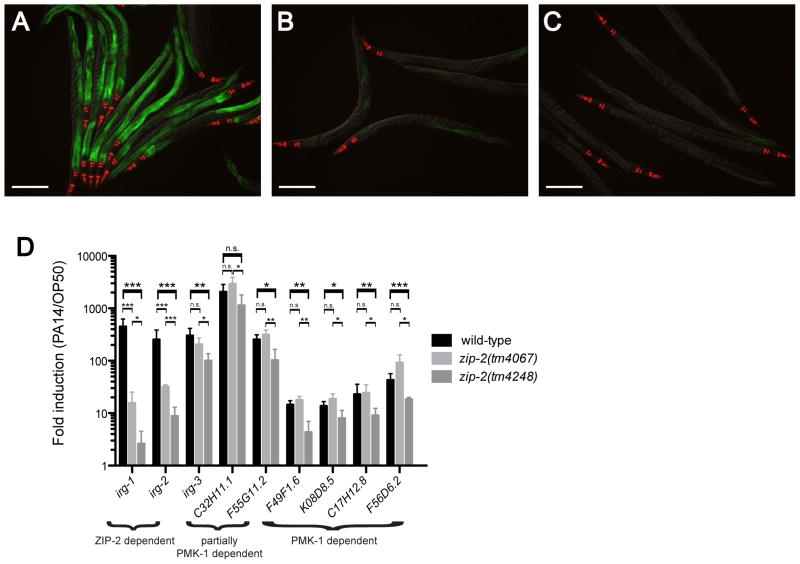
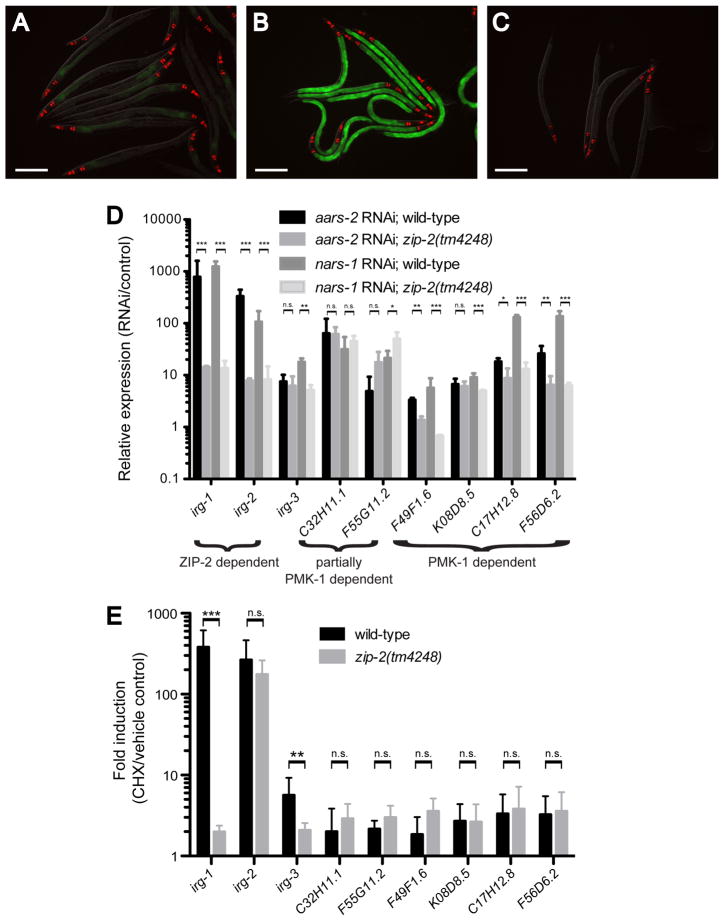
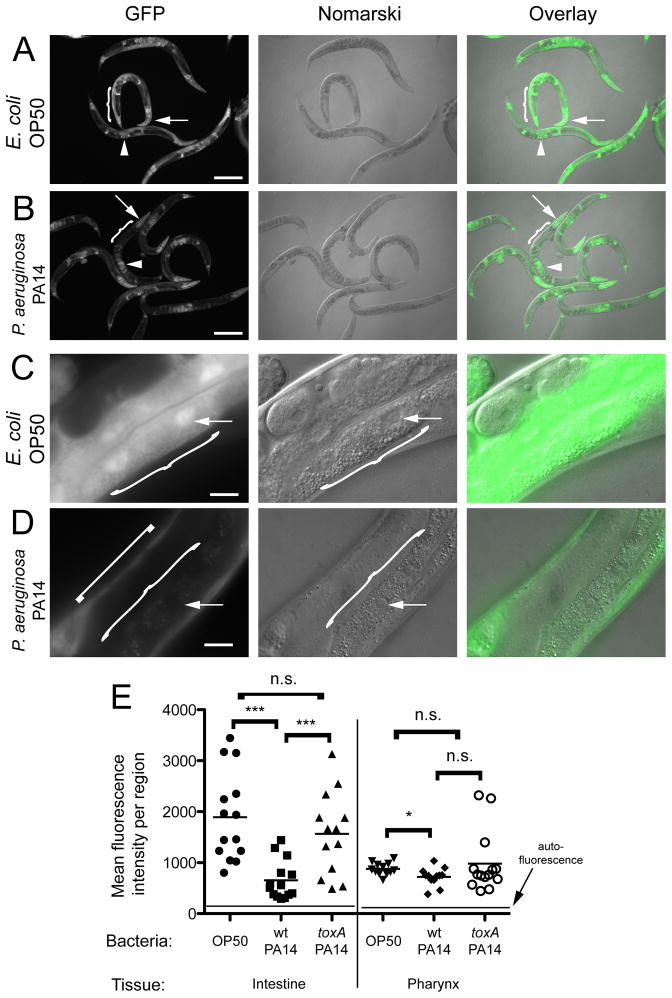
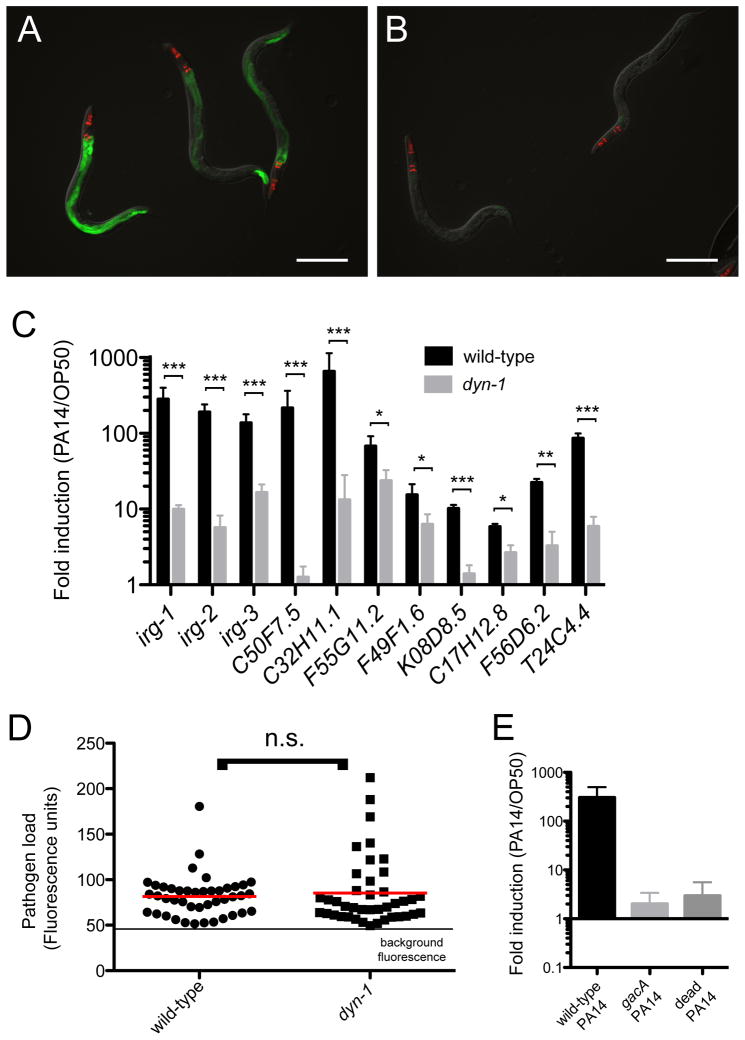
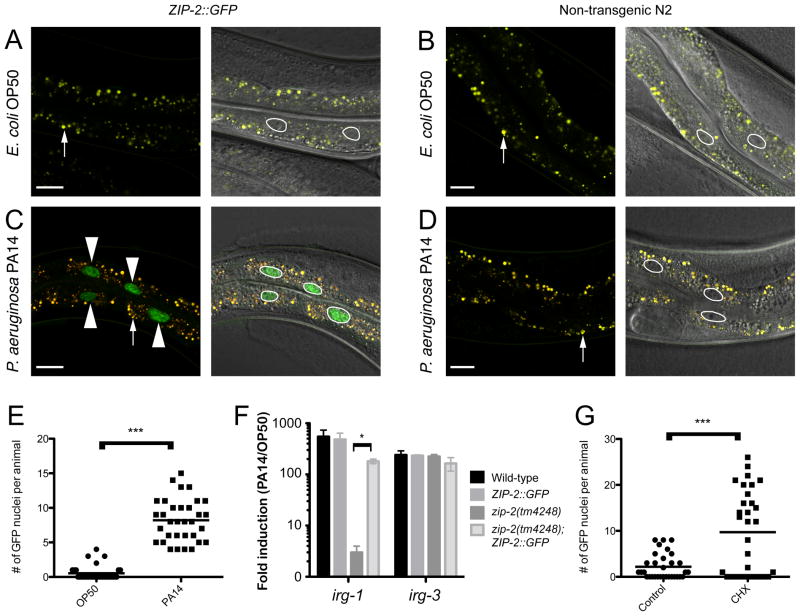
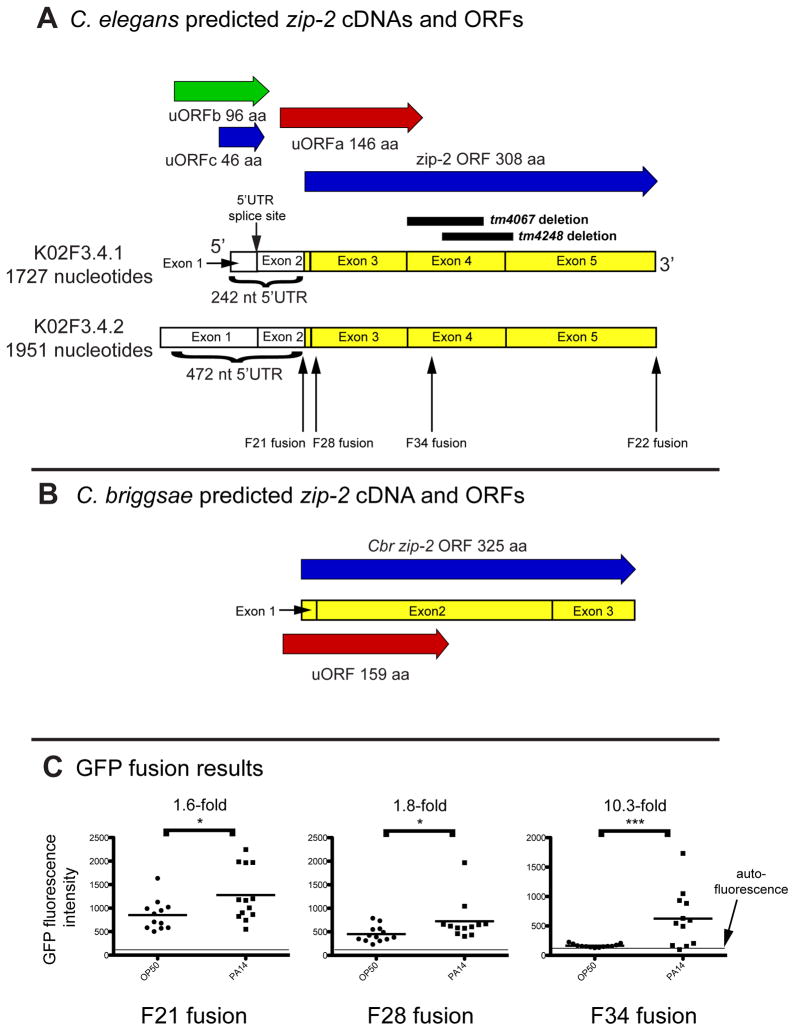
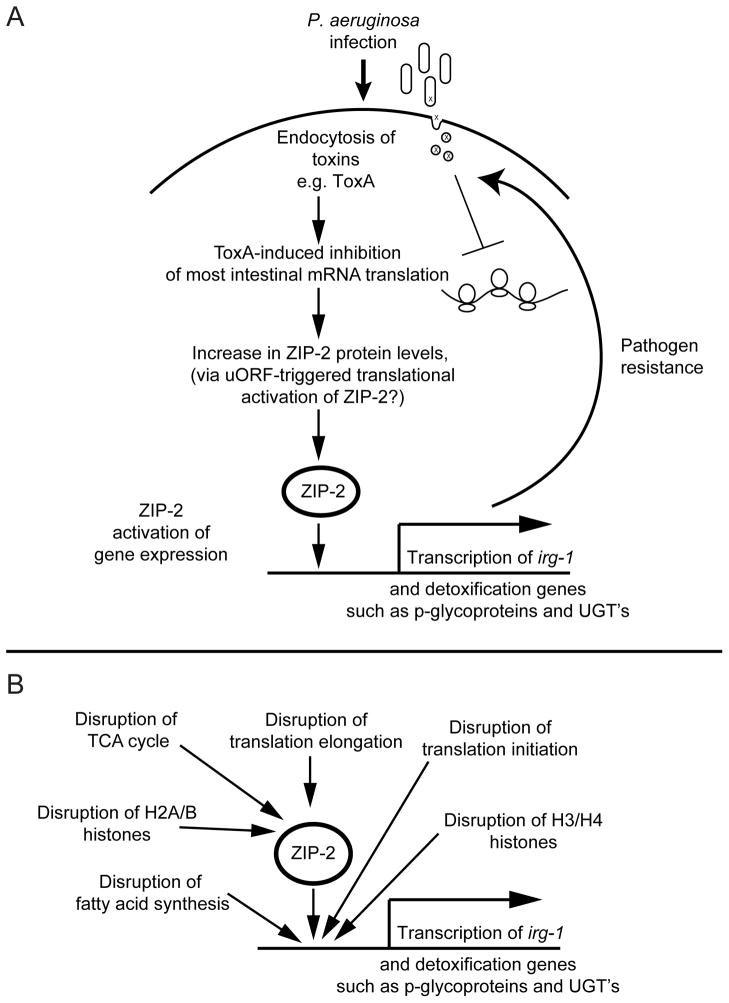
Pathogens commonly disrupt host cell processes or cause damage, but the surveillance mechanisms used by animals to monitor these attacks are poorly understood. Upon infection with pathogenic Pseudomonas aeruginosa, the nematode C. elegans upregulates infection response gene irg-1 using the zip-2 bZIP transcription factor. Here we show that P. aeruginosa infection inhibits mRNA translation in the intestine via the endocytosed translation inhibitor Exotoxin A, which leads to an increase in ZIP-2 protein levels. In the absence of infection we find that the zip-2/irg-1 pathway is upregulated following disruption of several core host processes, including inhibition of mRNA translation. ZIP-2 induction is conferred by a conserved upstream open reading frame in zip-2 that could derepress ZIP-2 translation upon infection. Thus, translational inhibition, a common pathogenic strategy, can trigger activation of an immune surveillance pathway to provide host defense.


Figures

Figure 1
Figure 1. zip-2(tm4248) mutants are defective in inducing irg-1 and irg-2 in response to infection
(A) Wild-type irg-1p::GFP animals infected with PA14. (B) zip-2(tm4067);irg-1p::GFP animals infected with PA14 – note reduced GFP fluorescence. (C) zip-2(tm4248);irg-1p::GFP animals infected with PA14 – note even further reduced fluorescence. Green is irg-1p::GFP and red is myo-2::mCherry expression in the pharynx as a marker for the transgene. Images in (A–C) are overlays of green, red and Nomarski channels. Scale bar is 200 μm. (D) qRT-PCR comparison of PA14 –induced gene expression in wild-type, zip-2(tm4067) and zip-2(tm4248) mutants. Note greater defect in irg-1 induction in zip-2(tm4248) compared to zip-2(tm4067). Results shown are the average of three independent biological replicates, error bars are SD. *** is p<0.001, ** is p<0.01, * is p<0.05 using one-sample one-tail or two-sample two-tail t-tests. n.s is not significant. See also Figure S1.
Figure 2
Figure 2. Translational inhibition induces zip-2-dependent expression of irg-1 in the absence of infection
(A) RNAi control (L4440)-treated irg-1p::GFP animals grown on E. coli. (B) tRNA synthetase nars-1 RNAi treated irg-1p::GFP animals grown on E. coli have increased GFP expression. (C) nars-1 RNAi treated irg-1p::GFP;zip-2(tm4248) animals grown on E. coli do not have increased GFP expression. Green is irg-1p::GFP and red is myo-2::mCherry expression in the pharynx as a marker for presence of the transgene. Images in (A–C) are overlays of green, red and Nomarski channels. Scale bar is 200 μm. (D) qRT-PCR comparison of infection response gene expression in animals grown on E. coli, as upregulated by aars-2 or nars-1 tRNA synthetase RNAi treatment compared to L4440 control treated animals, in wild-type or zip-2(tm4248) mutant background. (E) qRT-PCR comparison of infection response gene expression induced by 4 hours of 2 mg/ml cycloheximide (CHX) treatment compared to ethanol (vehicle control), in wild-type or zip-2(tm4248) mutant background. (D, E) Results shown are the average of three independent biological replicates, error bars are SD. *** is p<0.001, ** is p<0.01, * is p<0.05 using one-sample one-tailed t-test. n.s is not significant. See also Table S1.
Figure 3
Figure 3. P. aeruginosa infection blocks production of heat shock induced GFP in the intestine
(A) Animals grown on E. coli: hsp-16.2::GFP is induced broadly. (B) Animals infected with P. aeruginosa: hsp-16.2::GFP is still induced in many tissues, but is induced less in the intestine. In (A and B) pharynx indicated with arrow, developing embryos indicated with arrowhead, and intestine indicated with curly brace. Scale bar is 200 μm. (C) Animal grown on E. coli: hsp-16.2::GFP is induced strongly in the intestine, indicated with curly brace. (D) Animal infected with P. aeruginosa: hsp-16.2::GFP is not induced in the intestine indicated with curly brace, but is induced in hypodermis, indicated with square bracket. (C and D) Arrow indicates an intestinal nucleus and scale bar is 20 μm. (E) GFP fluorescence levels after heat shock in either the intestine or pharynx of animals fed either E. coli OP50, infected with wild-type P. aeruginosa PA14, or infected with toxA mutant P. aeruginosa. Each dot represents fluorescence quantified in one animal, horizontal lines for each sample indicate the mean, and the horizontal line at the bottom indicates the level of autofluorescence. Difference in the intestine is significant between OP50 and wild-type PA14, and between wild-type and toxA mutant PA14 (*** p<0.001 with a two-tailed t-test), but not between OP50 and toxA mutant PA14 (p=0.32). Difference in the pharynx is moderately significant between OP50 and wild-type PA14 (* p<0.05 with a two-tailed t-test) and not significant between wild-type PA14 and toxA mutant (p=0.16), or OP50 and toxA mutant PA14 (p=0.56). Similar results were obtained in seven independent experiments comparing OP50 and wild-type PA14, and four independent experiments also comparing toxA mutant PA14. See also Figure S2.
Figure 4
Figure 4. Endocytosis is important for induction of irg-1 and other infection response genes
(A)Wild-type irg-1p::GFP animals infected with P. aeruginosa for 8 hours. (B) dyn-1(ky51ts);irg-1p::GFP mutant animals infected with P. aeruginosa for 8 hours. (A, B) Green is irg-1p::GFP, red is myo-2::mCherry expression in the pharynx as a marker for presence of the transgene. (C) qPCR of wild-type vs. dyn-1(ky51ts) endocytosis-defective mutants. Results shown are the average of three independent biological replicates. Error bars are SD. *** is p<0.001, ** is p<0.01, * is p<0.05 using one-sample two-tailed t-test. (D) Pathogen load in wild-type and dyn-1(ky51ts) mutants. Each dot represents the entire intestine quantified in one animal, the red horizontal line indicates the mean of several animals and the horizontal line at bottom indicates autofluorescence. Difference is not significant (p=0.26, with a two-tailed t-test). (E) qRT-PCR measurements of irg-1 mRNA show that it is highly induced by wild-type PA14, but not by gacA mutant PA14 or heat-killed PA14. Results are the average of three independent experiments, error bars are SD. See also Figure S3.
Figure 5
Figure 5. ZIP-2::GFP transgene is induced by PA14 infection and translational inhibition
(A–D) In each panel, the left image shows GFP fluorescence in green indicated with arrowheads, and autofluorescence in yellow indicated with small arrows; the right image shows an overlay of Nomarski with the left image and white outlines to indicate nuclei. Scale bars are 20 μm. (A) ZIP-2::GFP transgenic animals do not show GFP expression when feeding on E. coli OP50, only autofluorescence. (B) N2 (non-transgenic) animals show autofluorescence on E. coli. (C) ZIP-2::GFP transgenic animals show nuclear GFP expression in the intestine when infected with P. aeruginosa PA14. Arrowheads indicate four examples of nuclei expressing GFP. (D) N2 animals show autofluorescence on PA14. (E) Number of intestinal nuclei with GFP expression per animal 4 hours after transfer to PA14 or OP50; each dot represents an animal and the horizontal bar indicates the mean. (F) qRT-PCR shows that the ZIP-2::GFP transgene rescues the irg-1 induction defect of zip-2(tm4248) mutants. Results are the average of two biological replicates, error bars are SD, * p<0.05 with two-tailed t-test. (G) Number of intestinal nuclei with GFP expression in animals 6 hours after transfer to 2 mg/ml cycloheximide (CHX) or ethanol (vehicle control); each dot represents an animal and the horizontal bar indicates the mean. (E and G) Experiments shown are representative of at least three independent biological replicates, >30 animals scored per condition in each experiment. *** indicates p<10−3 with a two-tailed t-test. See also Figure S4.
Figure 6
Figure 6. The zip-2 upstream region contains uORFs and confers upregulation upon infection
(A) K02F3.4.1 is a major mRNA isoform for zip-2, K02F3.4.2 is a minor mRNA isoform for zip-2. Both contain the predicted zip-2 ORF of 308 amino acids. zip-2(tm4067) and zip-2(tm4248) alleles are deletions (see Figure S1). Three predicted uORFs: uORFa in the -1 frame, uORFb in the -2 frame, uORFc in frame with ZIP-2. F21, F22, F28 and F34 refer to the location of GFP fusions. (B) C. briggsae predicted zip-2 cDNA and ORFs. uORF is in the -1 frame. Note that this predicted uORF has similar start, stop and frame as uORFa in C. elegans zip-2. (C) zip-2 region with uORFa confers induction of GFP upon infection with P. aeruginosa. Strains analyzed in this panel include jyEx6 (F21), jyEx21 (F28) and jyEx67 (F34). Results are from the same experiment with all strains tested in parallel. Each dot represents fluorescence quantified in one animal, the mean is shown with a horizontal line in the middle, and autofluorescence is indicated by a line at the bottom. * p<0.05, *** p<0.005 with a two-tailed t-test. Results are representative of at least three independent experiments.
Figure 7
Figure 7. Model for induction of C. elegans zip-2/irg-1 surveillance pathway
(A) Endocytosis of P. aeruginosa toxins causes translational inhibition, which activates zip-2 immune response pathway. (B) zip-2/irg-1 pathway is activated by disruption of several core host processes. See Discussion for details.

Comment in

References

    1. Auerbuch V, Golenbock DT, Isberg RR. Innate immune recognition of Yersinia pseudotuberculosis type III secretion. PLoS pathogens. 2009;5:e1000686. - PMC - PubMed
    1. Ausubel FM. Are innate immune signaling pathways in plants and animals conserved? Nature immunology. 2005;6:973–979. - PubMed
    1. Bielaszewska M, Mellmann A, Zhang W, Kock R, Fruth A, Bauwens A, Peters G, Karch H. Characterisation of the Escherichia coli strain associated with an outbreak of haemolytic uraemic syndrome in Germany, 2011: a microbiological study. Lancet Infect Dis 2011 - PubMed
    1. Boyer L, Magoc L, Dejardin S, Cappillino M, Paquette N, Hinault C, Charriere GM, Ip WK, Fracchia S, Hennessy E, et al. Pathogen-derived effectors trigger protective immunity via activation of the Rac2 enzyme and the IMD or Rip kinase signaling pathway. Immunity. 2011;35:536–549. - PMC - PubMed
    1. Burgess RJ, Zhang Z. Histones, histone chaperones and nucleosome assembly. Protein Cell. 2010;1:607–612. - PMC - PubMed

Publication types

MeSH terms