. 2012 Jun;22(6):1154-62.
doi: 10.1101/gr.135780.111. Epub 2012 Apr 20.

lobSTR: A short tandem repeat profiler for personal genomes

Affiliations

lobSTR: A short tandem repeat profiler for personal genomes

Melissa Gymrek et al. Genome Res. 2012 Jun.

Abstract

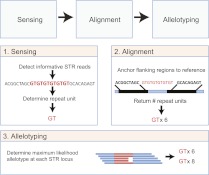
Short tandem repeats (STRs) have a wide range of applications, including medical genetics, forensics, and genetic genealogy. High-throughput sequencing (HTS) has the potential to profile hundreds of thousands of STR loci. However, mainstream bioinformatics pipelines are inadequate for the task. These pipelines treat STR mapping as gapped alignment, which results in cumbersome processing times and a biased sampling of STR alleles. Here, we present lobSTR, a novel method for profiling STRs in personal genomes. lobSTR harnesses concepts from signal processing and statistical learning to avoid gapped alignment and to address the specific noise patterns in STR calling. The speed and reliability of lobSTR exceed the performance of current mainstream algorithms for STR profiling. We validated lobSTR's accuracy by measuring its consistency in calling STRs from whole-genome sequencing of two biological replicates from the same individual, by tracing Mendelian inheritance patterns in STR alleles in whole-genome sequencing of a HapMap trio, and by comparing lobSTR results to traditional molecular techniques. Encouraged by the speed and accuracy of lobSTR, we used the algorithm to conduct a comprehensive survey of STR variations in a deeply sequenced personal genome. We traced the mutation dynamics of close to 100,000 STR loci and observed more than 50,000 STR variations in a single genome. lobSTR's implementation is an end-to-end solution. The package accepts raw sequencing reads and provides the user with the genotyping results. It is written in C/C++, includes multi-threading capabilities, and is compatible with the BAM format.


Figures

Figure 1.
Figure 1.
lobSTR algorithm overview. lobSTR consists of three steps. The sensing step detects informative STR reads and determines their repeat motif. The alignment step maps the STRs' flanking regions to the reference. The allelotyping step determines the STR alleles present at each locus.
Figure 2.
Figure 2.
lobSTR shows an added value for STR profiling over mainstream techniques. (A) Alignment speed (reads per second) of lobSTR, mainstream aligners, and BLAT. lobSTR processes reads between 2.5 and 1000 times faster than alternative methods. (B) The sensitivity of detecting STR variations of different alignment strategies. Only BLAT detected more STR variations than lobSTR. (C) lobSTR accurately detects pathogenic trinucleotide expansions that are discarded by mainstream aligners. The figure shows simulation results of the HOXD13 heterozygous locus with a normal and a pathogenic allele that contains seven additional alanine insertions. BWA reports only the normal allele. Reads exhibiting a pathogenic STR expansion are not detected. lobSTR identifies both alleles present at the simulated locus. All positions are according to hg18.
Figure 3.
Figure 3.
(A–C) Measuring lobSTR consistency from two samples of the same individual; (green) period 2; (orange) period 3; (red) period 4; (blue) period 5; (purple) period 6; (black) all. (A) Loci covered in both samples at increasing coverage thresholds. (B) The genotype discordance rate as a function of coverage threshold. (C) The allelic discordance rate as a function of coverage threshold. (D) Number of repeat differences at heterozygous loci. (Blue) No difference; (red) integer numbers of repeat differences; (green) noninteger numbers of repeat differences. Most discordance calls consist of a single repeat unit difference between calls in the two samples. Distance was measured as the second minimum distance between alleles of the two samples. The y-axis is given in a square root scale.
Figure 4.
Figure 4.
Validating lobSTR by Mendelian inheritance in a HapMap trio. Mendelian inheritance (blue and cyan) rose to 99% above 17× coverage. (Dark and light red) The number of covered loci at each coverage threshold. (A) Mendelian inheritance of all covered loci. (B) Mendelian inheritance of loci with discordant parental allelotypes.
Figure 5.
Figure 5.
Genome-wide STR profile of an individual. (A) Distribution of STRs with 20× coverage or more as a function of the allele size in hg18. (B) Distribution of allele size differences from reference in lobSTR calls. The average difference was 6.3 bp away from the reference. (C) STR polymorphism as a function of period. The number of STR alleles matching the reference sequence increases with increasing repeat unit length. (Red) Homozygous reference; (blue) heterozygous nonreference/reference; (green) homozygous nonreference/nonreference; (orange) heterozygous nonreference/nonreference. (D) Longer STR regions are more polymorphic. The median STR length (thick black line) increases with the number of variant alleles. (*) A significant (p < 0.05) difference according to a one-sided Mann–Whitney test. Boxes denote the interquartile range, and whiskers denote three times the interquartile range. (E) lobSTR shows mutational trends at single-base-pair resolution. The number of base pairs different from the reference modulo period size versus the number of alleles detected (in logarithmic scale) is shown for each period; (green) period 2; (orange) period 3; (red) period 4; (blue) period 5; (purple) period 6. Incomplete STR unit differences tend to differ by a full unit ±1 bp from the reference. (F) Fraction of trinucleotide STRs with nonreference alleles in introns versus exons. The 95% confidence intervals are given by the error bars.

References

    1. The 1000 Genomes Project Consortium 2010. A map of human genome variation from population-scale sequencing. Nature 467: 1061–1073 - PMC - PubMed
    1. Ajay SS, Parker SC, Abaan HO, Fajardo KV, Margulies EH 2011. Accurate and comprehensive sequencing of personal genomes. Genome Res 21: 1498–1505 - PMC - PubMed
    1. Ballantyne KN, Goedbloed M, Fang R, Schaap O, Lao O, Wollstein A, Choi Y, van Duijn K, Vermeulen M, Brauer S, et al. 2010. Mutability of Y-chromosomal microsatellites: Rates, characteristics, molecular bases, and forensic implications. Am J Hum Genet 87: 341–353 - PMC - PubMed
    1. Benson G 1999. Tandem repeats finder: A program to analyze DNA sequences. Nucleic Acids Res 27: 573–580 - PMC - PubMed
    1. Brais B, Bouchard JP, Xie YG, Rochefort DL, Chretien N, Tome FM, Lafreniere RG, Rommens JM, Uyama E, Nohira O, et al. 1998. Short GCG expansions in the PABP2 gene cause oculopharyngeal muscular dystrophy. Nat Genet 18: 164–167 - PubMed

Publication types