. 2012 Jul;61(7):1801-13.
doi: 10.2337/db11-0832. Epub 2012 Apr 20.

Adipose tissue overexpression of vascular endothelial growth factor protects against diet-induced obesity and insulin resistance

Affiliations

Adipose tissue overexpression of vascular endothelial growth factor protects against diet-induced obesity and insulin resistance

Ivet Elias et al. Diabetes. 2012 Jul.

Abstract

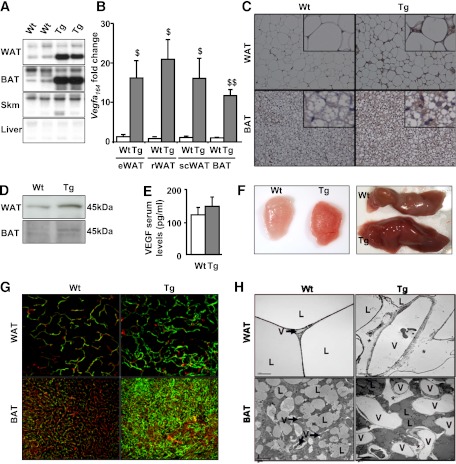
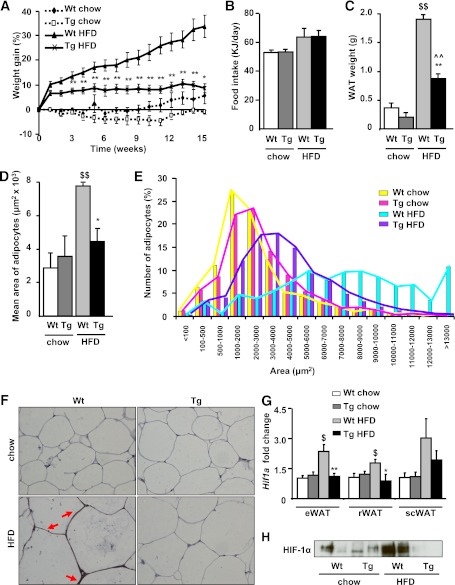
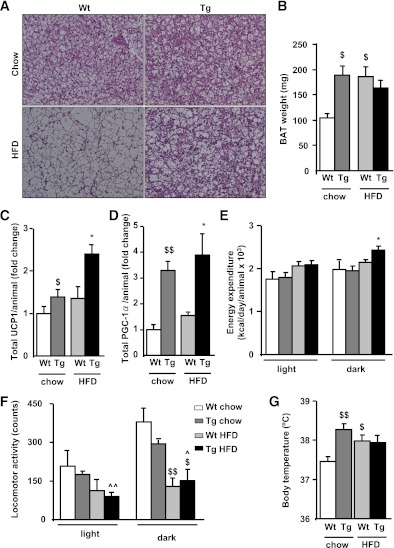
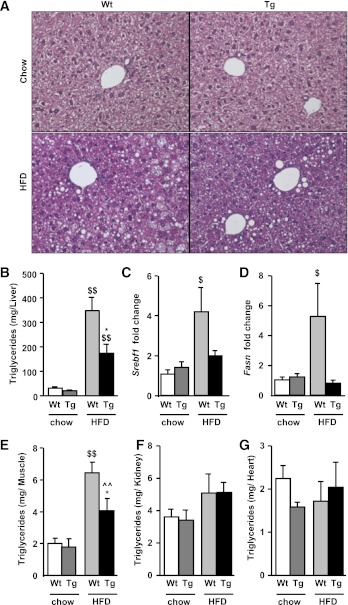
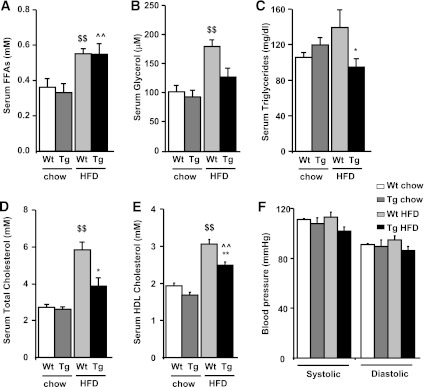
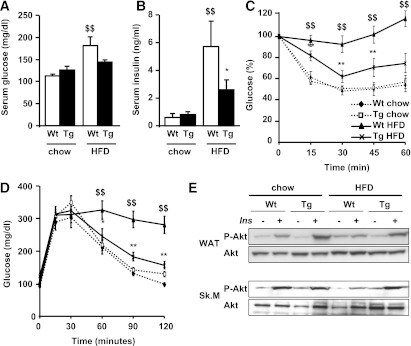
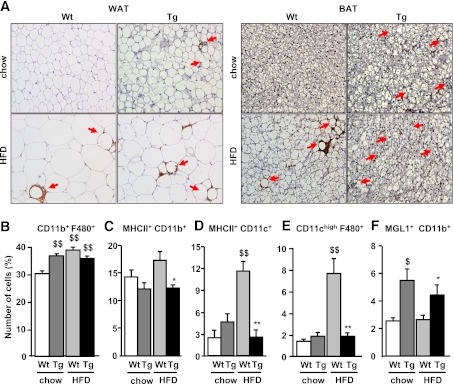
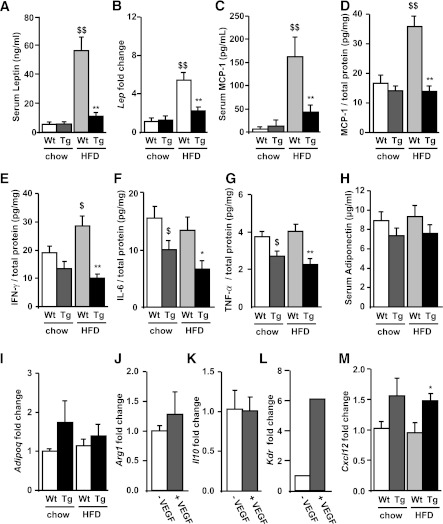
During the expansion of fat mass in obesity, vascularization of adipose tissue is insufficient to maintain tissue normoxia. Local hypoxia develops and may result in altered adipokine expression, proinflammatory macrophage recruitment, and insulin resistance. We investigated whether an increase in adipose tissue angiogenesis could protect against obesity-induced hypoxia and, consequently, insulin resistance. Transgenic mice overexpressing vascular endothelial growth factor (VEGF) in brown adipose tissue (BAT) and white adipose tissue (WAT) were generated. Vessel formation, metabolism, and inflammation were studied in VEGF transgenic mice and wild-type littermates fed chow or a high-fat diet. Overexpression of VEGF resulted in increased blood vessel number and size in both WAT and BAT and protection against high-fat diet-induced hypoxia and obesity, with no differences in food intake. This was associated with increased thermogenesis and energy expenditure. Moreover, whole-body insulin sensitivity and glucose tolerance were improved. Transgenic mice presented increased macrophage infiltration, with a higher number of M2 anti-inflammatory and fewer M1 proinflammatory macrophages than wild-type littermates, thus maintaining an anti-inflammatory milieu that could avoid insulin resistance. These studies suggest that overexpression of VEGF in adipose tissue is a potential therapeutic strategy for the prevention of obesity and insulin resistance.


Figures

FIG. 1.
FIG. 1.
Adipose-specific overexpression of VEGF led to increased vessel density. A: Representative Northern blot of epididymal WAT, BAT, skeletal muscle, and liver from wild-type (Wt) and transgenic (Tg) mice specific for Vegfa. B: Vegfa164 expression was analyzed by quantitative real-time PCR in epididymal WAT (eWAT), retroperitoneal WAT (rWAT), subcutaneous WAT (scWAT), and BAT and was normalized by 36B4 expression. Data represent the mean ± SEM of at least seven animals per group. $P < 0.05 vs. Wt. $$P < 0.01 vs. Wt. C: VEGF immunohistochemistry in WAT and BAT. Figure shows representative images at original magnification ×200, with insets at higher magnification. D: Representative WAT and BAT Western blots blotted with an antibody against VEGF and showing a band of 45 KDa corresponding to VEGF. E: Serum VEGF levels were measured in serum samples by enzyme-linked immunosorbent assay. Data represent the mean ± SEM of at least seven animals per group. F: Representative macroscopic images of eWAT (left) and interscapular BAT (right). G: Images of WAT and BAT angiographies were taken after a tail-vein dextran-conjugated fluorescein injection (green) and in toto with phalloidin (red), by confocal microscopy (original magnification ×400). Angiographies represent an overlay of 20 images (WAT) or 30 images (BAT) separated by 1 μm. H: Transmission electron microscopy study of capillary ultrastructure in WAT and BAT (original magnification ×2,000). L, lipid droplets; V, blood vessels; *, edema. (A high-quality digital representation of this figure is available in the online issue.)
FIG. 2.
FIG. 2.
Reduced adiposity in aP2VEGF transgenic (Tg) mice fed an HFD. Weight gain (A) and food intake (B), calculated as estimated metabolisable energy of wild-type (Wt) and Tg mice fed chow or an HFD for 15 weeks. Data represent the mean ± SEM of at least 10 animals per group. C: Epididymal WAT weight. D: Mean adipocyte area. E: Frequency distribution of adipocyte area in Wt and Tg mice fed chow or an HFD. Data represent the mean ± SEM of at least four animals per group. F: Representative hypoxyprobe sections of epididymal WAT, counterstained with hematoxylin (original magnification ×400). Red arrows indicate hypoxyprobe signal. G: Hif1a expression was analyzed by quantitative real-time PCR in epididymal WAT (eWAT), retroperitoneal WAT (rWAT), and subcutaneous WAT (scWAT), and was normalized by 36B4 expression. Data represent the mean ± SEM of at least seven animals per group. H: Representative WAT Western blot blotted with an antibody against HIF-1α. *P < 0.05 vs. Wt HFD. **P < 0.01 vs. Wt HFD. $P < 0.05 vs. Wt chow. $$P < 0.01 vs. Wt chow. ^^P < 0.01 vs. Tg chow. (A high-quality digital representation of this figure is available in the online issue.)
FIG. 3.
FIG. 3.
Transgenic (Tg) mice showed increased BAT thermogenesis and energy expenditure. A: Representative sections of BAT, stained with hematoxylin-eosin (original magnification ×200) for Tg and wild-type (Wt) mice. B: Interscapular BAT tissue weight. Data represent the mean ± SEM of at least 10 animals per group. Total content of UCP1 (C) and PGC-1α (D) were determined by Western blot densitometry, taking into account the amount of total BAT protein. Data represent the mean ± SEM of at least four animals per group. Energy expenditure (E) and locomotor activity (F) was measured with an indirect open circuit calorimeter in Wt and Tg mice fed chow or an HFD for 15 weeks. Data were taken during the light and dark cycles and represent the mean ± SEM of at least eight animals per group. G: Body temperature was measured in awake animals using an intrarectal probe. Data represent the mean ± SEM of at least 10 animals per group. *P < 0.05 vs. Wt HFD. $P < 0.05 vs. Wt chow. $$P < 0.01 vs. Wt chow. ^P < 0.05 vs. Tg chow. ^^P < 0.01 vs. Tg chow. (A high-quality digital representation of this figure is available in the online issue.)
FIG. 4.
FIG. 4.
Transgenic (Tg) mice showed decreased hepatic fat accumulation compared with wild-type (Wt) mice. A: Representative sections of liver, stained with hematoxylin-eosin (original magnification ×400). B: Liver triglyceride content was determined as indicated in research design and methods. Srebf1 (C) and Fasn (D) liver expression were analyzed by quantitative real-time PCR and normalized by 36B4 expression. Triglyceride content was determined in muscle (E), kidney (F), and heart (G) as indicated in research design and methods. Data represent the mean ± SEM of at least 10 animals per group. *P < 0.05 vs. Wt HFD. $P < 0.05 vs. Wt chow. $$P < 0.01 vs. Wt chow. ^^P < 0.01 vs. Tg chow. (A high-quality digital representation of this figure is available in the online issue.)
FIG. 5.
FIG. 5.
Levels of circulating metabolites and blood pressure were determined in transgenic (Tg) and wild-type (Wt) mice fed chow and HFD. Serum levels of FFAs (A), glycerol (B), triglycerides (C), total cholesterol (D), and HDL cholesterol (E) were analyzed, and systolic and diastolic blood pressure (F) was determined as indicated in research design and methods. Data represent the mean ± SEM of at least 10 animals per group. *P < 0.05 vs. Wt HFD. **P < 0.01 vs. Wt HFD. $$P < 0.01 vs. Wt chow. ^^P < 0.01 vs. Tg chow.
FIG. 6.
FIG. 6.
aP2VEGF transgenic (Tg) mice are protected against diet-induced glucose intolerance and insulin resistance compared with wild-type (Wt) mice. Blood glucose (A) and insulin (B) levels are shown in chow and HFD-fed mice. Data represent the mean ± SEM of at least 10 animals per group. C: Insulin sensitivity was determined after an intraperitoneal injection of insulin (0.75 units/kg body weight). Results are calculated as the percentage of initial blood glucose levels. Data represent the mean ± SEM of at least eight animals per group. D: Glucose tolerance was determined in fasted mice after an intraperitoneal injection of glucose (2 g/kg body weight), and blood glucose levels were measured at the indicated time points. Data represent the mean ± SEM of at least eight animals per group. E: Representative Western blots are shown for total Akt and phosphorylated Akt (p-Akt) levels in WAT and skeletal muscle (Sk.M) before and after insulin stimulation in chow- and HFD-fed mice, as indicated in research design and methods. *P < 0.05 vs. Wt HFD. **P < 0.01 vs. Wt HFD. $$P < 0.01 vs. Wt chow.
FIG. 7.
FIG. 7.
Study of WAT and BAT infiltrates. A: MAC-2 immunohistochemistry was performed in WAT and BAT of wild-type (Wt) and transgenic (Tg) mice (representative images at original magnification ×200). Red arrows indicate MAC-2 signal. Flow cytometry analysis of CD11b+ F480+ (B), MHCII+ CD11b+ (C), MHCII+ CD11c+ (D), CD11chigh F4/80+ (E), and MGL1+ CD11b+ (F) cells in WAT. The stroma vascular fraction from Wt and Tg mice fed chow or an HFD was double incubated with corresponding antibodies to detect different cell populations. Data represent the mean ± SEM of at least five animals for each group. *P < 0.05 vs. Wt HFD. **P < 0.01 vs. Wt HFD. $P < 0.05 vs. Wt chow. $$P < 0.01 vs. Wt chow. (A high-quality digital representation of this figure is available in the online issue.)
FIG. 8.
FIG. 8.
Effects of VEGF on macrophage phenotype in transgenic (Tg) and wild-type (Wt) mice. A: Serum leptin levels were determined by enzyme-linked immunosorbent assay (ELISA) as indicated in research design and methods. B: Lep expression in WAT was analyzed by quantitative real-time PCR and normalized by 36B4 expression. C: Serum MCP-1 levels were determined by ELISA as indicated in research design and methods. D: Protein MCP-1 levels in WAT were analyzed by Luminex and calculated as MCP-1 per total protein. WAT IFN-γ (E), IL-6 (F), and TNF-α (G) levels were determined by Luminex, as indicated in research design and methods, and results were calculated per total protein. H: Serum adiponectin levels were determined by radioimmunoassay, as indicated in research design and methods. I: Adipoq expression in WAT was analyzed by quantitative real-time PCR and normalized by 36B4 expression. BMDMs of Wt mice were treated with or without VEGF and Arg1 (J), Il10 (K), and Kdr (L) expression levels were determined by quantitative real-time PCR and normalized by 36B4 expression. M:WAT Cxcl12 expression was analyzed by quantitative real-time PCR and normalized by 36B4 expression. Data represent the mean ± SEM of at least 10 animals per group. *P < 0.05 vs. Wt HFD. **P < 0.01 vs. Wt HFD. $P < 0.05 vs. Wt chow. $$P < 0.01 vs. Wt chow.

Comment in

References

    1. Cornier MA, Dabelea D, Hernandez TL, et al. The metabolic syndrome. Endocr Rev 2008;29:777–822 - PMC - PubMed
    1. James WP. The epidemiology of obesity: the size of the problem. J Intern Med 2008;263:336–352 - PubMed
    1. Rutkowski JM, Davis KE, Scherer PE. Mechanisms of obesity and related pathologies: the macro- and microcirculation of adipose tissue. FEBS J 2009;276:5738–5746 - PMC - PubMed
    1. Hosogai N, Fukuhara A, Oshima K, et al. Adipose tissue hypoxia in obesity and its impact on adipocytokine dysregulation. Diabetes 2007;56:901–911 - PubMed
    1. Rausch ME, Weisberg S, Vardhana P, Tortoriello DV. Obesity in C57BL/6J mice is characterized by adipose tissue hypoxia and cytotoxic T-cell infiltration. Int J Obes (Lond) 2008;32:451–463 - PubMed

Publication types

MeSH terms

Substances