. 2012 Jun;9(6):609-14.
doi: 10.1038/nmeth.1985. Epub 2012 Apr 22.

Systematic evaluation of factors influencing ChIP-seq fidelity

Affiliations

Systematic evaluation of factors influencing ChIP-seq fidelity

Yiwen Chen et al. Nat Methods. 2012 Jun.

Abstract

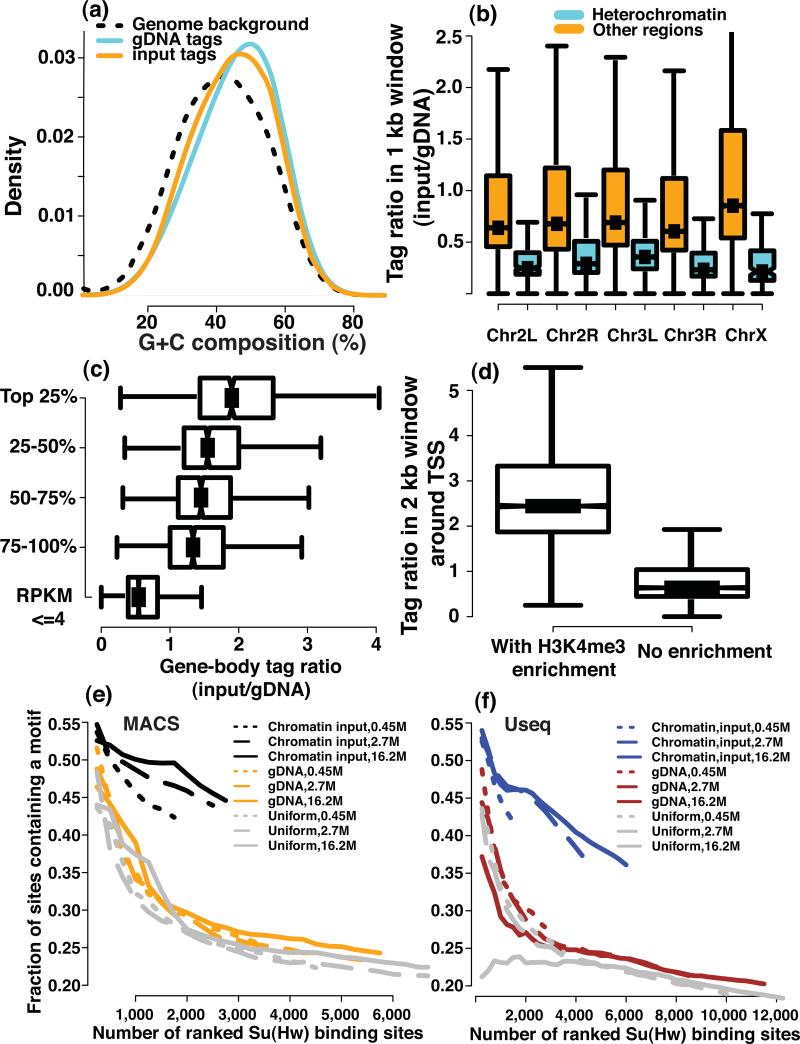
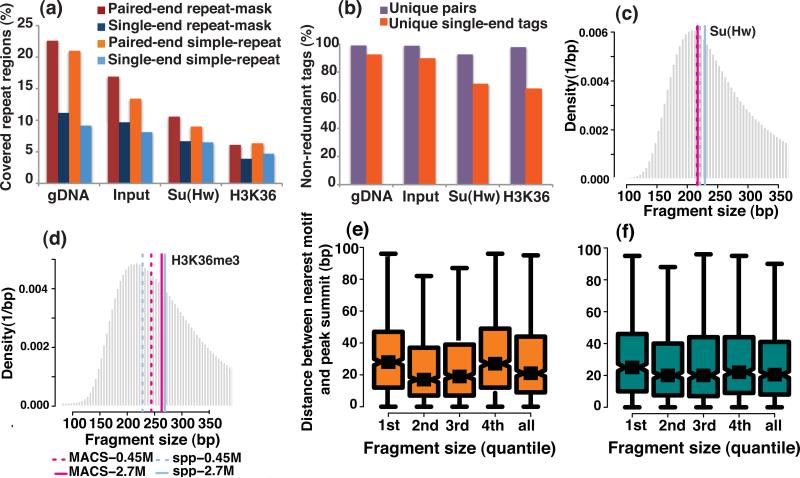
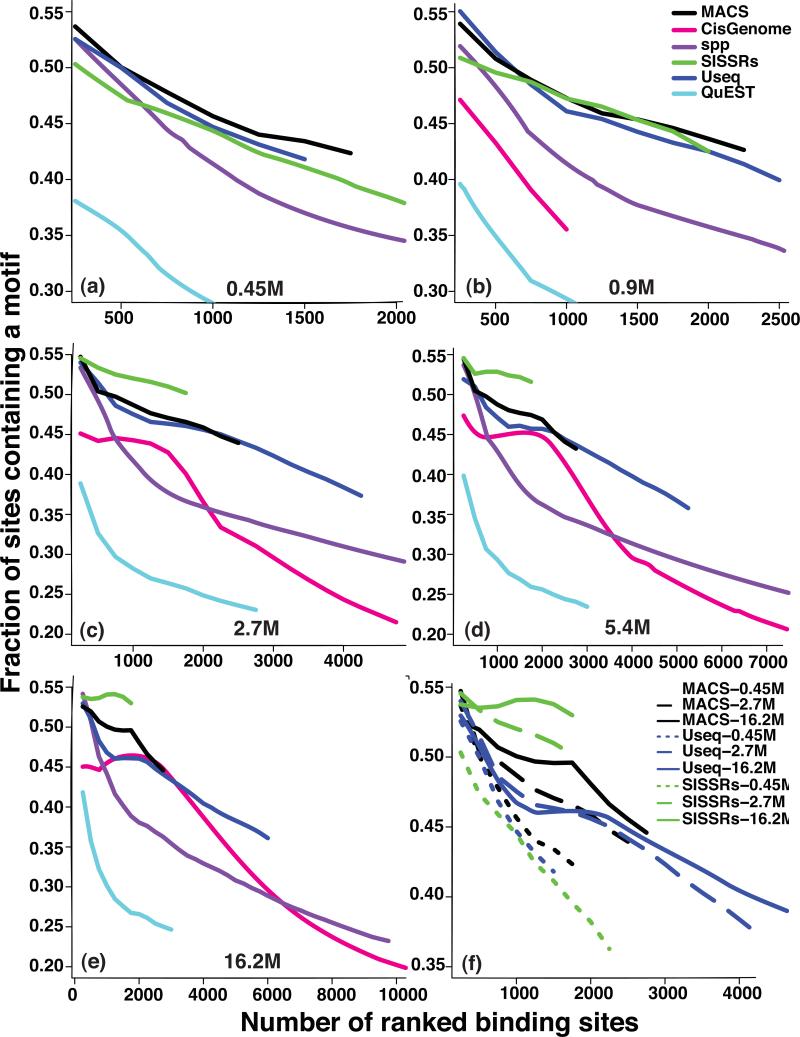
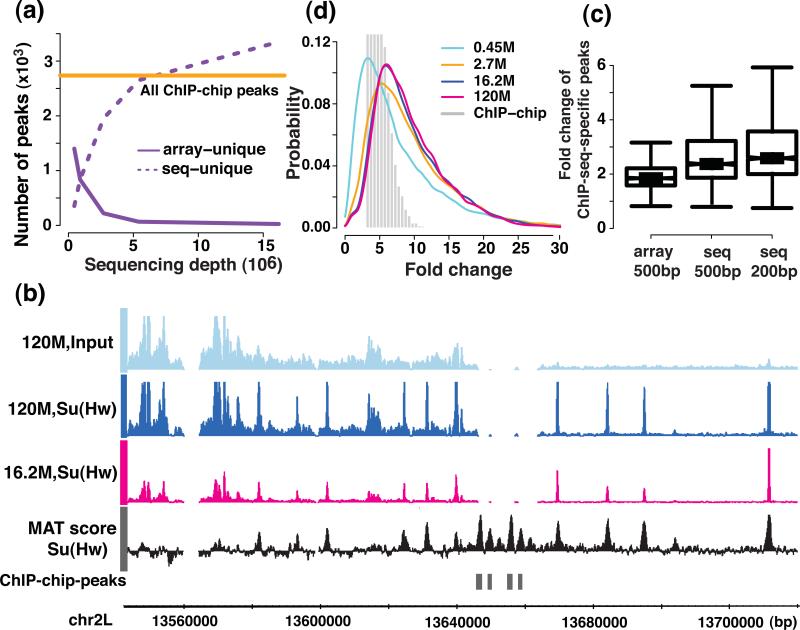
We evaluated how variations in sequencing depth and other parameters influence interpretation of chromatin immunoprecipitation-sequencing (ChIP-seq) experiments. Using Drosophila melanogaster S2 cells, we generated ChIP-seq data sets for a site-specific transcription factor (Suppressor of Hairy-wing) and a histone modification (H3K36me3). We detected a chromatin-state bias: open chromatin regions yielded higher coverage, which led to false positives if not corrected. This bias had a greater effect on detection specificity than any base-composition bias. Paired-end sequencing revealed that single-end data underestimated ChIP-library complexity at high coverage. Removal of reads originating at the same base reduced false-positives but had little effect on detection sensitivity. Even at mappable-genome coverage depth of ∼1 read per base pair, ∼1% of the narrow peaks detected on a tiling array were missed by ChIP-seq. Evaluation of widely used ChIP-seq analysis tools suggests that adjustments or algorithm improvements are required to handle data sets with deep coverage.


Figures

Figure 1
Figure 1. The impact of genomic sequence composition and chromatin state on read coverage
(a) The histograms of GC composition for reads from gDNA and chromatin input samples are compared with the genomic background. Boxplots of the read count ratio of chromatin input to a gDNA sample are shown for (b) non-overlapping 1 kb windows in annotated heterochromatin and euchromatin regions of the corresponding chromosomes, (c) for the 2 kb windows centered at TSS that are with or without H3K4me3 enrichment, and (d) for the coding regions of genes with different expression levels (e,f) The fraction of computationally identified Su(Hw) peaks that contains a Su(Hw) binding motif is plotted as a function of the number of top-ranked binding sites for different types of controls (chromatin input, genomic DNA and a uniform background) and for two algorithms (e) MACS and (f) Useq. The ranking is based on the statistical significance of each peak that is assigned by individual algorithms.
Figure 2
Figure 2. A comparison of several features between the PE and SE reads, and an evaluation of the effect of DNA fragment size
The features include (a) genomic coverage in repeat regions and (b) the estimated library complexity for PE and SE reads. The repeat-mask refers to the DNA sequences of interspersed repeats and of low-complexity DNA that were identified by the RepeatMasker program (Online Methods). The simple-repeat refers to the simple tandem repeats (possibly imperfect repeats) that were located by the Tandem Repeats Finding program (Online Methods). . Fragment size that was estimated from the SE reads by MACS and spp was compared with the mode of the fragment size histogram that was derived from the PE reads for the (c) Su(Hw) and (d) H3K36me3 ChIP samples. The pink solid and dashed lines represent the fragment size that was estimated from the SE reads by MACS at the sequencing depth of 2.7M and 0.45M reads, respectively. The blue solid and dashed lines represent the fragment size that was estimated from the SE reads by spp at the sequencing depth of 2.7M and 0.45M reads. A box-plot comparison of the summit resolution of the peaks identified by (e) MACS and (f) spp is shown for the cases in which PE reads from DNA fragments with different sizes were used.
Figure 3
Figure 3. Quality of the Su(Hw) peaks
The fraction Su(Hw) peaks, identified by the indicated peak callers, that contains a Su(Hw) binding motif is plotted as a function of the number of top-ranked binding sites at the sequencing depths of 0.45 M (a), 0.9 M (b) 2.7 M (c), 5.4 M (d), and 16.2 M (e) reads. The ranking is based on the statistical significance of each peak that is assigned by an individual algorithm. The evaluation results for the top 3 best-performing peak-callers at sequencing depths of 0.45 M, 2.7 M, and 16.2 M are shown in (f).
Figure 4
Figure 4. Comparison of the identified narrow peaks and the dynamic range between the sequencing and the tiling array platform
(a) the number of identified peaks on different platforms and (b) examples of ChIP-chip peaks that were missed in the sequencing platform, the MAT score for ChIP-chip data, and the ChIP-seq signal coverage at the sequencing depths of 16.2 M and 120 M are shown. (c) The fold change difference between sequencing and tiling arrays in 200 bp and 500 bp windows centered on the peaks that were unique to the sequencing platform at a sequencing depth of 16.2 M (d) the dynamic range of the signal (ChIP versus the chromatin input fold change) are shown for the sequencing and the tiling array platform.
Figure 5
Figure 5. An evaluation of the reproducibility across replicates of six peak-callers
The number of reproducible peaks at various IDR levels is plotted for sequencing depths of 0.45 M (a), 0.9 M (b), 2.7 M (c), 5.4 M (d), and 16.2 M (e) reads. In (f), the number of reproducible peaks identified at an IDR of 5% is plotted as a function of sequencing depth.

References

    1. Johnson DS, Mortazavi A, Myers RM, Wold B. Genome-wide mapping of in vivo protein-DNA interactions. Science. 2007;316:1497–1502. - PubMed
    1. Robertson G, et al. Genome-wide profiles of STAT1 DNA association using chromatin immunoprecipitation and massively parallel sequencing. Nat Methods. 2007;4:651–657. - PubMed
    1. Barski A, et al. High-resolution profiling of histone methylations in the human genome. Cell. 2007;129:823–837. - PubMed
    1. Mikkelsen TS, et al. Genome-wide maps of chromatin state in pluripotent and lineage-committed cells. Nature. 2007;448:553–560. - PMC - PubMed
    1. Johnson DS, et al. Systematic evaluation of variability in ChIP-chip experiments using predefined DNA targets. Genome Res. 2008;18:393–403. - PMC - PubMed

Publication types

MeSH terms

Associated data