. 2012 May 30;31(11):2566-78.
doi: 10.1038/emboj.2012.101. Epub 2012 Apr 20.

Co-transcriptional degradation of aberrant pre-mRNA by Xrn2

Affiliations

Co-transcriptional degradation of aberrant pre-mRNA by Xrn2

Lee Davidson et al. EMBO J. .

Abstract

Eukaryotic protein-coding genes are transcribed as pre-mRNAs that are matured by capping, splicing and cleavage and polyadenylation. Although human pre-mRNAs can be long and complex, containing multiple introns and many alternative processing sites, they are usually processed co-transcriptionally. Mistakes during nuclear mRNA maturation could lead to potentially harmful transcripts that are important to eliminate. However, the processes of human pre-mRNA degradation are not well characterised in the human nucleus. We have studied how aberrantly processed pre-mRNAs are degraded and find a role for the 5'→3' exonuclease, Xrn2. Xrn2 associates with and co-transcriptionally degrades nascent β-globin transcripts, mutated to inhibit splicing or 3' end processing. Importantly, we provide evidence that many endogenous pre-mRNAs are also co-transcriptionally degraded by Xrn2 when their processing is inhibited by Spliceostatin A. Our data therefore establish a previously unknown function for Xrn2 and an important further aspect of pre-mRNA metabolism that occurs co-transcriptionally.


Conflict of interest statement

The authors declare that they have no conflict of interest.

Figures

Figure 1
Figure 1
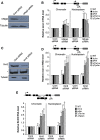
Aberrant β-globin transcripts are degraded at chromatin sites. (A) Schematic diagram of the plasmids used to study β-globin pre-mRNA degradation. The HIV promoter (arrow) is followed by the β-globin gene with numbered exons (black boxes), pA signal (pA), and terminator element (grey box) indicated. The In1m, pAm, ΔTIn1m and ΔTpAm derivatives are also shown and the position of respective mutations is indicated with a cross. (B) Real-time PCR analysis of exon 3-containing β-globin transcripts in total RNA isolated from WT, In1m, pAm, ΔTIn1m and ΔTpAm transfected cells. Diagram shows the position of the primer pair (arrows). Quantitation is expressed in relation to values obtained from WT samples, which were set to 1 following normalisation to signal from co-transfected VA. (C) Northern blotting of total RNA isolated from WT, In1m, pAm, ΔTIn1m and ΔTpAm transfected cells. Spliced and partially spliced products as well as the EPO co-transfection product are indicated. Diagram shows exon 3 probe (grey line). (D) Northern blotting of chromatin-associated, nucleoplasmic and cytoplasmic RNA isolated from WT, In1m, pAm, ΔTIn1m and ΔTpAm transfected cells. Spliced and partially spliced products as well as the EPO co-transfection product are indicated. Diagram shows exon 3 probe (grey line). (E) Real-time PCR analysis of exon 3 β-globin transcript levels in chromatin-associated and nucleoplasmic RNA isolated from cells transfected with WT, In1m, pAm, ΔTIn1m or ΔTpAm. Diagram shows the positions of primer pairs used. Quantitation is in relation to values obtained from WT samples, which were set to 1 following normalisation to signal from co-transfected VA. (F) Real-time PCR analysis of exon 2-exon 3 β-globin transcript levels in chromatin-associated and nucleoplasmic RNA isolated from cells transfected with WT, In1m, pAm, ΔTIn1m or ΔTpAm. Diagram shows the positions of primer pairs used. Quantitation is in relation to values obtained from WT samples, which were set to 1 following normalisation to signal from co-transfected VA. All error bars represent the standard deviation from the mean (s.d.) from a minimum of three biological replicates. * and **indicate P-values of <0.05 and <0.01 respectively. Figure source data can be found with the Supplementary data.
Figure 2
Figure 2
Roles of hRrp6 and Xrn2 in the degradation of aberrant β-globin transcripts. (A) Western blot showing RNAi depletion of hRrp6 protein. Antibodies were used to detect γ-Tubulin (lower panel) or hRrp6 (top panel) in extracts from cells transfected with control or hRrp6-specific siRNA. (B) Real-time PCR analysis of exon 3-containing β-globin transcripts in chromatin-associated and nucleoplasmic RNA samples obtained from mock or hRrp6 depleted cells transfected with WT, In1m, pAm, ΔTIn1m or ΔTpAm. The diagram shows the position of primers (arrows). For each transfected gene, values obtained from mock treated cells were set to 1 following normalisation to signal from co-transfected VA. (C). Western blot showing RNAi depletion of Xrn2 protein. Antibodies were used to detect γ-Tubulin (lower panel) or Xrn2 (top panel) in extracts from cells transfected with control or Xrn2-specific siRNA. Middle panel (marked *) shows a non-specific band detected by the Xrn2 antibody, which acts as an additional loading control. (D) Real-time PCR analysis of exon 3-containing β-globin transcripts in chromatin-associated and nucleoplasmic samples obtained from mock or Xrn2 depleted cells transfected with WT, In1m, pAm, ΔTIn1m or ΔTpAm. The diagram shows the position of primers (black arrows). For each transfected gene, values obtained from mock treated cells were set to 1 following normalisation to signal from co-transfected VA. (E) Real-time PCR analysis of spliced (exon2-exon3) β-globin transcripts in chromatin-associated and nucleoplasmic samples obtained from mock or Xrn2 depleted cells transfected with WT, In1m, pAm, ΔTIn1m or ΔTpAm. Diagram shows position of primers (grey arrows). For each transfected gene, values obtained from mock treated cells were set to 1 following normalisation to signal from co-transfected VA. All error bars represent the s.d. from a minimum of three biological replicates. *indicates P-value of <0.05. Figure source data can be found with the Supplementary data.
Figure 3
Figure 3
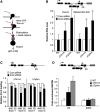
Actively transcribed nascent RNAs are bound to and degraded by Xrn2. (A) Diagram of 4-thio UTP NRO procedure. Pol II in isolated nuclei was ‘run on’ in the presence of 4thio UTP (star). Nascent, 4-thio UTP labelled, transcripts were purified by biotinylation (grey circle) and selection with streptavidin magnetic beads (black circle). These were then analysed by reverse transcription and real-time PCR. (B) Real-time PCR analysis of exon3-containing and spliced β-globin transcripts in nascent RNA samples obtained from mock or Xrn2 depleted cells transfected with WT, ΔTIn1m or ΔTpAm. Samples obtained from Xrn2 depleted cells were quantitated in relation to those obtained from control samples, which were set at 1 following normalisation to signal from co-transfected VA. (C) Analysis of Pol II loading on ΔTIn1m or ΔTpAm plasmids in mock and Xrn2 depleted cells using ChIP. Diagram shows positions of the PCR amplicons to detect Pol II loading at the promoter (grey arrows) and exon 3 (black arrows). Graph shows relative Pol II loading, calculated from the % input of each immunoprecipitation, which was given a value of 1 in control cells. (D) RNA immunoprecipitation analysis of Xrn2 bound transcripts in WT, ΔTIn1m and ΔTpAm transfected cells. Diagram shows positions of PCR amplicons to detect exon 3 (black arrows) and spliced (grey arrows) transcripts. Quantitation is expressed as fold enrichment over background expressed relative to that found for GAPDH mRNA, which was given a value of 1. All error bars represent the s.d. from a minimum of three biological replicates. *indicates P-value of <0.05.
Figure 4
Figure 4
Co-transcriptional degradation of endogenous pre-mRNAs following Spliceostatin A treatment. (A) Bioinformatic analysis of transcripts and genes containing introns that are either increased or decreased by 2-fold or more upon SSA treatment. (B) Real-time PCR analysis of intron transcripts in chromatin-associated RNA isolated from control (MeOH) or SSA treated cells. Primer pairs detected the first intron from GRAMD3, H2AFY, PDE8B, EFNA5, DAP, STEAP4 or P27 transcripts. Graph shows quantitation where the value obtained from control cells were set to 1 following adjustment to TAF7 levels. (C) Real time PCR analysis of spliced transcripts is chromatin-associated RNA isolated from control (MeOH) or SSA treated cells. Primer pairs detected spliced transcripts (exon1-exon2) from GRAMD3, H2AFY, PDE8B, EFNA5, DAP, STEAP4 or P27 genes. Graph shows quantitation where the value obtained from control cells were set to 1 following adjustment to TAF7 levels. (D) Analysis of Pol II loading on GRAMD3, H2AFY, PDE8B, EFNA5, DAP, STEAP4 or P27 genes in control (MeOH) and SSA treated cells using ChIP. The %IP of input was calculated for each probe in each sample. %IP of each amplicon is shown for SSA treated cells but was compared to that obtained in control cells, where the value was set to 1. All error bars represent the s.d. from a minimum of three biological replicates. * and **indicate P-value of <0.05 and <0.01 respectively.
Figure 5
Figure 5
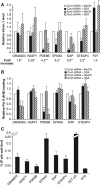
Xrn2 degrades endogenous pre-mRNAs following treatment with Spliceostatin A. (A) Real-time PCR analysis of intron transcripts in chromatin-associated RNA isolated from mock treated or Xrn2 depleted cells treated with MeOH or SSA. Primer pairs detected the first intron from GRAMD3, H2AFY, PDE8B, EFNA5, DAP, STEAP4 or P27 transcripts. Graph shows quantitation where the values obtained from control siRNA transfected cells treated with MeOH were given a value of 1 after adjustment to TAF7 levels. Fold increase was calculated from the product ratio in SSA:MeOH in control and Xrn2 depleted cells and was given a value of 1 in control cells. (B) ChIP analysis of Pol II loading (4H8 antibody) in mock treated or Xrn2 depleted cells treated or not with SSA. Graph shows relative Pol II loading, calculated from the % input of each immunoprecipitation, which was given a value of 1 in control siRNA transfected cells treated with MeOH. (C) ChIP of Xrn2 recruitment to chromatin. Quantitation is expressed as percentage of input DNA immunoprecipitated with anti-Xrn2. The NTS signal derives from a region on chromosome 10 with no annotated genes. All error bars represent the s.d. from a minimum of three biological replicates. * and **indicate P-values of <0.05 and <0.01 respectively.
Figure 6
Figure 6
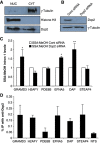
Dcp2 depletion stabilises some SSA sensitive transcripts. (A) Western blotting of nuclear and cytoplasmic protein fractions analysing γ-Tubulin (top panel), Histone H3 (middle panel) and Dcp2 (lower panel). (B)Western blot showing RNAi depletion of Dcp2 protein. Antibodies were used to detect γ-Tubulin (lower panel) or Dcp2 (top panel) in extracts from cells transfected with control or Dcp2-specific siRNA. (C) Real-time PCR analysis of intron transcripts in chromatin-associated RNA isolated from mock treated or Dcp2 depleted cells treated with MeOH or SSA. Primer pairs detected the first intron from GRAMD3, H2AFY, PDE8B, EFNA5, DAP or STEAP4 transcripts. Graph shows quantitation, which is presented as a ratio of each product in SSA vs MeOH treated cells. The value for each primer pair obtained in mock siRNA treated cells was set to 1. (D) ChIP of Dcp2 recruitment to chromatin. Quantitation is expressed as percentage of input DNA immunoprecipitated with anti-Dcp2. The NTS signal derives from a region on chromosome 10 with no annotated genes. All error bars represent the s.d. from a minimum of three biological replicates. * and **indicate P-values of <0.05 and <0.01 respectively. Figure source data can be found with the Supplementary data.

References

    1. Adams SE, Johnson ID, Braddock M, Kingsman AJ, Kingsman SM, Edwards RM (1988) Synthesis of a gene for the HIV transactivator protein TAT by a novel single stranded approach involving in vivo gap repair. Nucleic Acids Res 16: 4287–4298 - PMC - PubMed
    1. Andrulis ED, Werner J, Nazarian A, Erdjument-Bromage H, Tempst P, Lis JT (2002) The RNA processing exosome is linked to elongating RNA polymerase II in Drosophila. Nature 420: 837–841 - PubMed
    1. Ashe HL, Monks J, Wijgerde M, Fraser P, Proudfoot NJ (1997) Intergenic transcription and transinduction of the human beta-globin locus. Genes Dev 11: 2494–2509 - PMC - PubMed
    1. Ballarino M, Pagano F, Girardi E, Morlando M, Cacchiarelli D, Marchioni M, Proudfoot NJ, Bozzoni I (2009) Coupled RNA processing and transcription of intergenic primary microRNAs. Mol Cell Biol 29: 5632–5638 - PMC - PubMed
    1. Bentley DL (2005) Rules of engagement: co-transcriptional recruitment of pre-mRNA processing factors. Curr Opin Cell Biol 17: 251–256 - PubMed

Publication types