. 2012 May 31;485(7400):593-8.
doi: 10.1038/nature11044.

In vivo reprogramming of murine cardiac fibroblasts into induced cardiomyocytes

Affiliations

In vivo reprogramming of murine cardiac fibroblasts into induced cardiomyocytes

Li Qian et al. Nature. .

Abstract

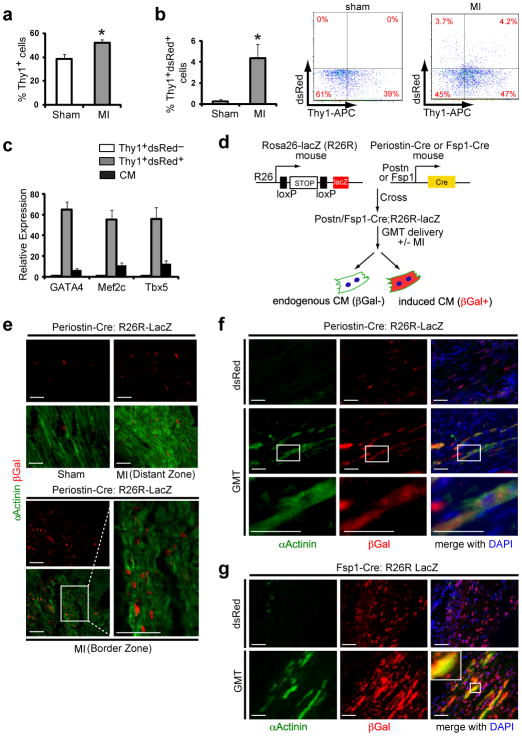
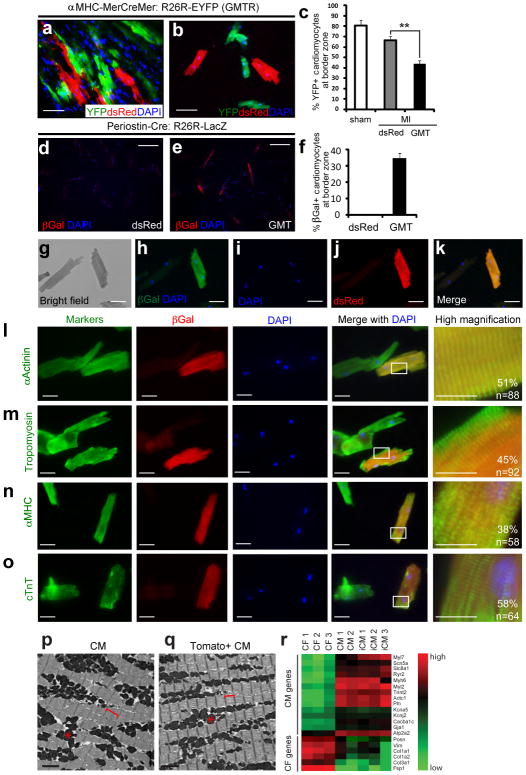
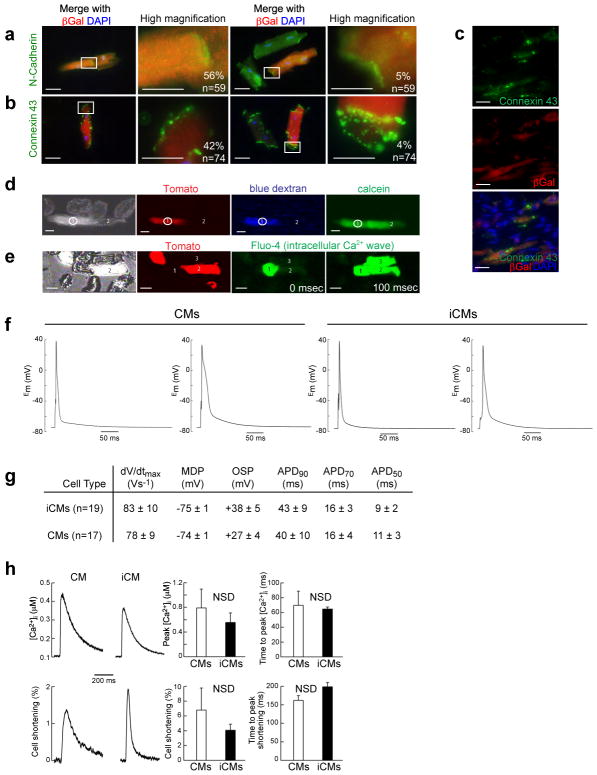
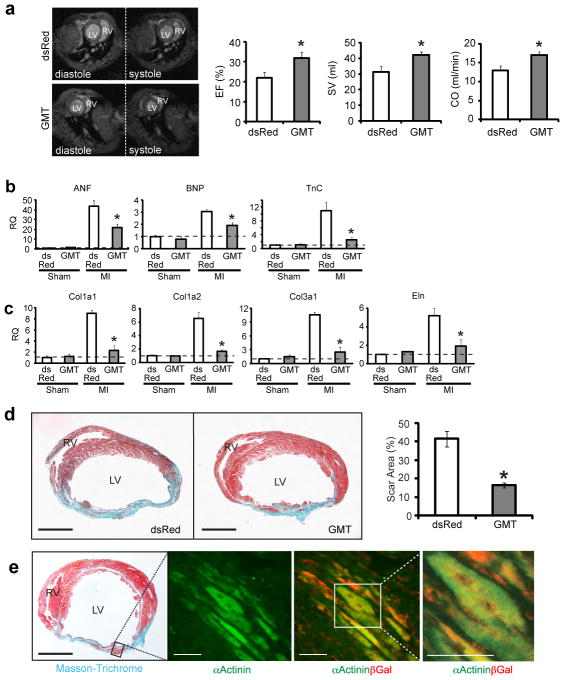
The reprogramming of adult cells into pluripotent cells or directly into alternative adult cell types holds great promise for regenerative medicine. We reported previously that cardiac fibroblasts,which represent 50%of the cells in the mammalian heart, can be directly reprogrammed to adult cardiomyocyte-like cells in vitro by the addition of Gata4, Mef2c and Tbx5 (GMT). Here we use genetic lineage tracing to show that resident non-myocytes in the murine heart can be reprogrammed into cardiomyocyte-like cells in vivo by local delivery of GMT after coronary ligation. Induced cardiomyocytes became binucleate, assembled sarcomeres and had cardiomyocyte-like gene expression. Analysis of single cells revealed ventricular cardiomyocyte-like action potentials, beating upon electrical stimulation, and evidence of electrical coupling. In vivo delivery of GMT decreased infarct size and modestly attenuated cardiac dysfunction up to 3 months after coronary ligation. Delivery of the pro-angiogenic and fibroblast-activating peptide, thymosin b4, along with GMT, resulted in further improvements in scar area and cardiac function. These findings demonstrate that cardiac fibroblasts can be reprogrammed into cardiomyocyte-like cells in their native environment for potential regenerative purposes.


Figures

Figure 1
Figure 1. Genetic lineage tracing demonstrates in vivo reprogramming of cardiac fibroblasts to cardiomyocyte-like cells
a, Quantification of FACS analyses for Thy1+ cells from sham-operated mouse hearts or hearts 2 days after myocardial infarction (MI) (n=3, *p<0.05). b, FACS analyses of Thy1+ dsRed+ cells from sham-operated or post-MI hearts injected with dsRed-expressing retrovirus, with quantification (left) and representative FACS plots (right) (n=3, *p<0.05). c, qPCR analysis of Gata4, Mef2c and Tbx5 in Thy1+ dsRed+ cells or endogenous cardiomyocytes (CMs) compared toThy1+ dsRed cells sorted two days after post-MI intramyocardial GMTR (Gata4, Mef2c, Tbx5, and dsRed) injection. n=3 with technical quadruplicates. d, Schematic diagram showing the genetic fate mapping method to trace the lineage of CMs reprogrammed from Periostin-Cre:R26R-lacZ or Fsp1-Cre:R26R-lacZ cells. e, Immunofluorescent staining for α-Actinin (green), βGalactosidase (βGal, red) and DAPI (blue) on sham-operated or post-MI Periostin-Cre:R26R-lacZ mouse hearts 4 weeks post-surgery. Images are from distant or border zones where endogenous CMs were labeled by α-Actinin, but were never co-localized with βGal (n=5 hearts/condition, 8 sections/heart). Scale bar, 50 μm. f–g, Immunofluorescent staining for α-Actinin, βGal and DAPI in infarct areas of dsRed- or GMT-injected Periostin-Cre:R26R-lacZ (f) or Fsp1-Cre:R26R-lacZ (g) mouse hearts 4 weeks post-MI. Boxed areas indicate regions of magnification. Scale bar, 50 μm. Error bars indicate standard error of the mean (SEM).
Figure 2
Figure 2. Cellular analysis of the degree of in vivo cardiac reprogramming
a, Immunofluorescent (IF) staining for YFP, dsRed, and DAPI on heart sections from tamoxifen “pulse-labeled” reprogrammed hearts injected with GMT plus dsRed (GMTR). Scale bar, 50 μm. b, IF staining for YFP, dsRed, and DAPI on isolated CMs from the infarct/border zone of pulse-labeled reprogrammed hearts. Scale bar: 100 μm. c, Quantification of the percentage of YFP+ cardiomyocytes in the infarct/border zone of pulse-labeled mouse hearts injected with dsRed (control) or GMT compared to sham (**p<0.01, n=3). d–f, IF staining for βGal and DAPI on isolated CMs from the infarct/border zone of Postn-Cre:R26R-lacZhearts 4 weeks after dsRed (d) or GMT (e) injection with quantification in (f). n=221 cells from three hearts for dsRed group; n=182 cells from three hearts for GMT group. Scale bar, 200 μm. g–k, Bright-field image of CMs isolated from GMTR-injected Postn-Cre:R26R-lacZ hearts 4 weeks after MI (g). Among these cells, a βGal positive cell is shown (h) that also co-stained with dsRed (j,k). Scale bar, 50 μm. l–o, Immunofluorescent staining for cardiac markers—including α-Actinin, Tropomyosin, cardiac myosin heavy chain (MHC), and cardiac Troponin T (cTnT)—co-labeled with βGal and DAPI, in isolated CMs from the infarct/border zone of Postn-Cre:R26R-lacZ hearts 4 weeks after GMT injection. The images display representative reprogrammed CMs next to endogenous CMs from the same preparation. Quantification of cells with full sarcomere development is shown, with the full spectrum of marker expression, localization, and quantification shown in Suppl. Fig. 8. White boxes in the merged pictures indicate the areas for high magnification images shown in the far right panels. Scale bar, 50 μm for the first three columns, 20 μm for the last column. p–q, Electron microscopy of endogenous CMs or reprogrammed CMs, as identified by the Postn-Cre:R26R-Tomato lineage marker (Tomato+ CM). Asterisk indicates mitochondria and brackets indicate sarcomeric units. Scale bar, 2 μm. r, Heat map of gene expression for a panel of CM- or fibroblast-enriched genes in isolated adult cardiac fibroblasts (CFs), CMs or iCMs based on lineage markers. The complete data set with statistics is provided in Suppl. Fig. 9. Error bars indicate standard error of the mean (SEM).
Figure 3
Figure 3. Electrophysiological properties of induced cardiomyocytes
a–b, Immunofluorescent staining for N-Cadherin (a) or Connexin 43 (b), co-labeled with βGal and DAPI in isolated CMs from Postn-Cre:R26R-lacZ hearts 4 weeks after injury. Boxed areas are shown in higher magnification with the percent of cells having the indicated morphology. Green cells represent endogenous CMs, and red/orange cells are iCMs. (c) Immunohistochemistry for Connexin 43 on sections from the infarct/border zone of Postn-Cre:R26R-lacZ hearts 4 weeks after GMT injection. Scale bar: 50 μm in the 1st and 3rd columns of (a,b) and all of (c); 20 μm in the 2nd and 4th columns of (a,b). d, Representative images of two CMs in contact with one another, including an iCM (red, cell #1) and an endogenous CM (non-red, cell #2) loaded with large (dextran) or small (calcein) dye. The large blue dextrandye loaded in the iCM (cell #1) by whole-cell patch-clamp method did not travel to the CM (cell #2), but the smaller, gap junction–permeable dye calcein did cross the cell border (n=5). Scale bar: 50 μm. e, Video frames captured from a group of myocytes, including endogenous CMs (non-red, #1&3) and an iCM (red, #2) imaged for Fluo-4 fluorescence transients corresponding to sarcoplasmic reticulum Ca2+ releases. Video frames 100 ms apart show that the Ca2+ release has spread throughout the myocyte group, including the iCM (n=6). Scale bar: 50 μm. f, Intracellular electrical recording of in vivo–derived YFP+ iCMs and endogenous YFP CMs from the same preparation. g, Table of action potential parameters measured for CMs and iCMs, including maximum upstroke velocity (dV/dtMax) and minimum diastolic potential (MDP) measured immediately preceding stimulation, overshoot potential (OSP), and the action potential durations (APD) at 90, 70, and 50% repolarization. h, Characteristic single field–stimulated [Ca2+] transients recorded from endogenous (left panel) or induced (right panel) CMs. Lower panels show the simultaneously recorded percent cell shortening responses triggered by the Ca2+ transients, in the same two cells. Quantifications from 6 iCMs and 4 endogenous CMs are shown in the right four panels. For experiments performed in d–h, Cells were isolated from Postn-Cre:Rosa-YFP mice 8 weeks post-MI and virus transduction. Error bars indicate standard error of the mean (SEM).
Figure 4
Figure 4. In vivo delivery of cardiac reprogramming factors improves cardiac function after myocardial infarction
a, Ejection fraction (EF), stroke volume (SV), and cardiac output (CO) of the left ventricle were quantified by magnetic resonance imaging (MRI) 12 weeks after MI (n=9 for each group, *p<0.05). Left four panels show representative transverse images of the thorax, containing hearts at the end of diastole (relaxation) or systole (contraction) from dsRed- or GMT-injected mice, compared to sham-operated age- and strain-matched controls. b, qPCR of atrial natriuretic factor (ANF), brain natriuretic peptide(BNP) and Tenascin (TnC) on RNA extracted from the border zone of hearts 4 weeks after MI and injection of dsRed or GMT. c, qPCR of collagen type I alpha 1 (Col1a1), Col1a2, Col3a1 and elastin (Eln) on RNA extracted from the border zone of hearts 4 weeks after MI and injection of dsRed or GMT. Data in (b) and (c) are relative to dsRed-injected sham-operated mice, indicated by the dashed line. n=3 for each genotype with technical quadruplicates. *p<0.05. d, Masson-Trichrome staining on heart sections 8 weeks post-MI injected with dsRed or GMT with quantification of scar size. Scale bars: 500 μm. (dsRed, n=8; GMT, n=9; *p<0.05). e, Masson-Trichrome (left panel) and immunofluorescent staining for α-Actinin and/or βGal (right panels) in GMT injected Postn-Cre:R26R-lacZ mouse heart 4 weeks post-surgery. Scale bars: 500 μm in the left panel, 50 μm in the right two panels. Error bars indicate standard error of the mean (SEM).

Comment in

References

    1. Murry CE, Keller G. Differentiation of embryonic stem cells to clinically relevant populations: Lessons from embryonic development. Cell. 2008;132:661–680. - PubMed
    1. Passier R, van Laake LW, Mummery CL. Stem-cell-based therapy and lessons from the heart. Nature. 2008;453:322–329. - PubMed
    1. Srivastava D, Ivey KN. Potential of stem-cell-based therapies for heart disease. Nature. 2006;441:1097–1099. - PubMed
    1. Takahashi K, Yamanaka S. Induction of pluripotent stem cells from mouse embryonic and adult fibroblast cultures by defined factors. Cell. 2006;126:663–676. - PubMed
    1. Takahashi K, et al. Induction of pluripotent stem cells from adult human fibroblasts by defined factors. Cell. 2007;131:861–872. - PubMed

Publication types

MeSH terms