. 2012 Jul;264(1):234-41.
doi: 10.1148/radiol.12112033. Epub 2012 Apr 20.

High-resolution 3D MR microangiography of the rat ocular circulation

Affiliations

High-resolution 3D MR microangiography of the rat ocular circulation

Yen-Yu I Shih et al. Radiology. 2012 Jul.

Abstract

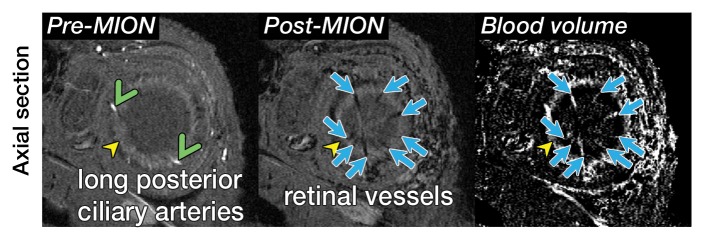
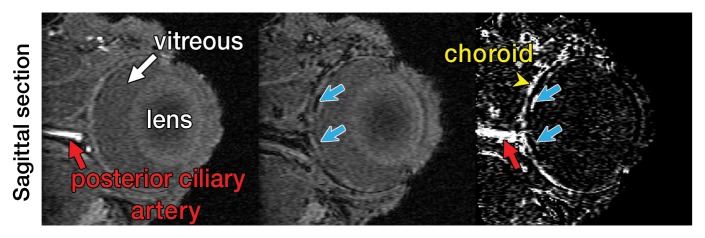
Purpose: To develop high-spatial-resolution magnetic resonance (MR) microangiography techniques to image the rat ocular circulation.

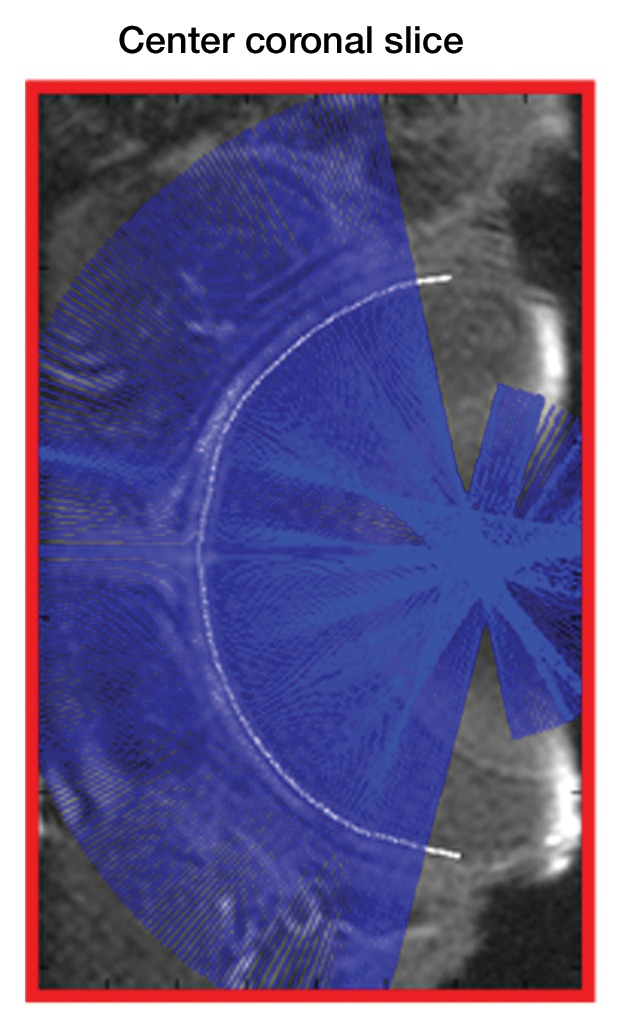
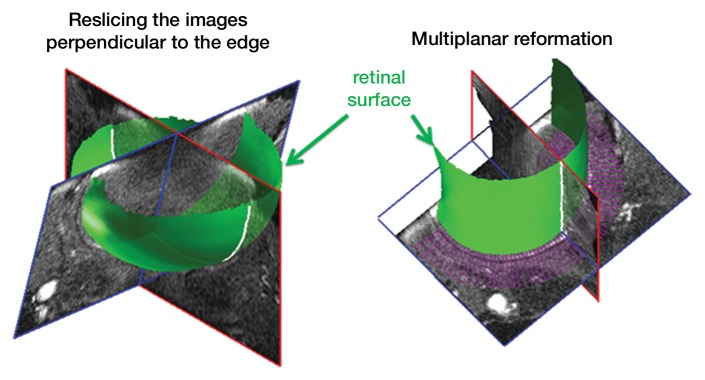
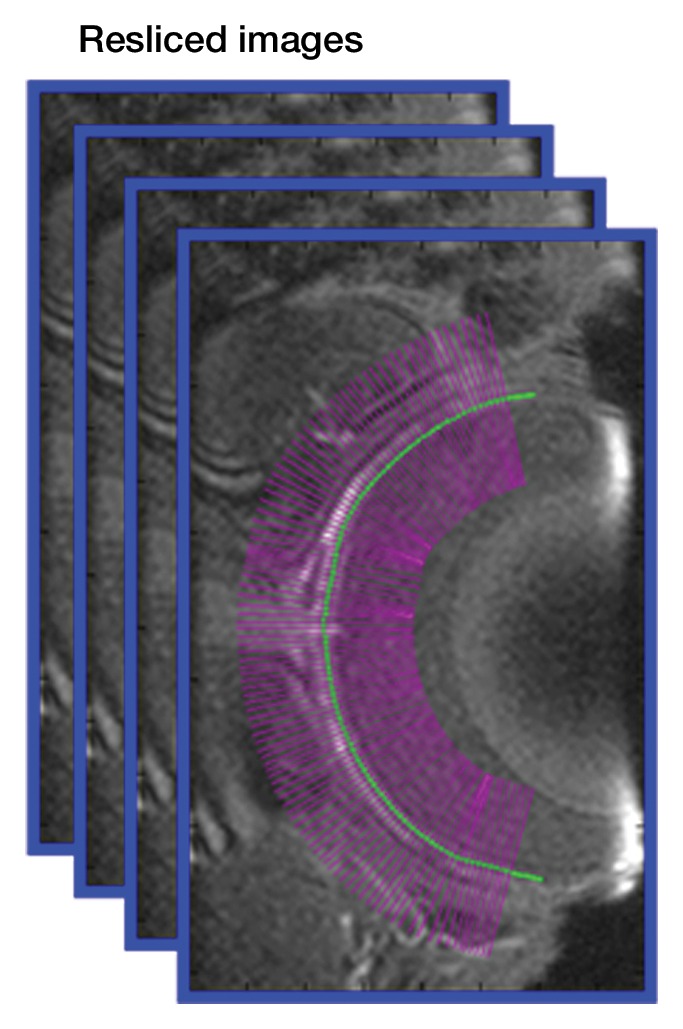
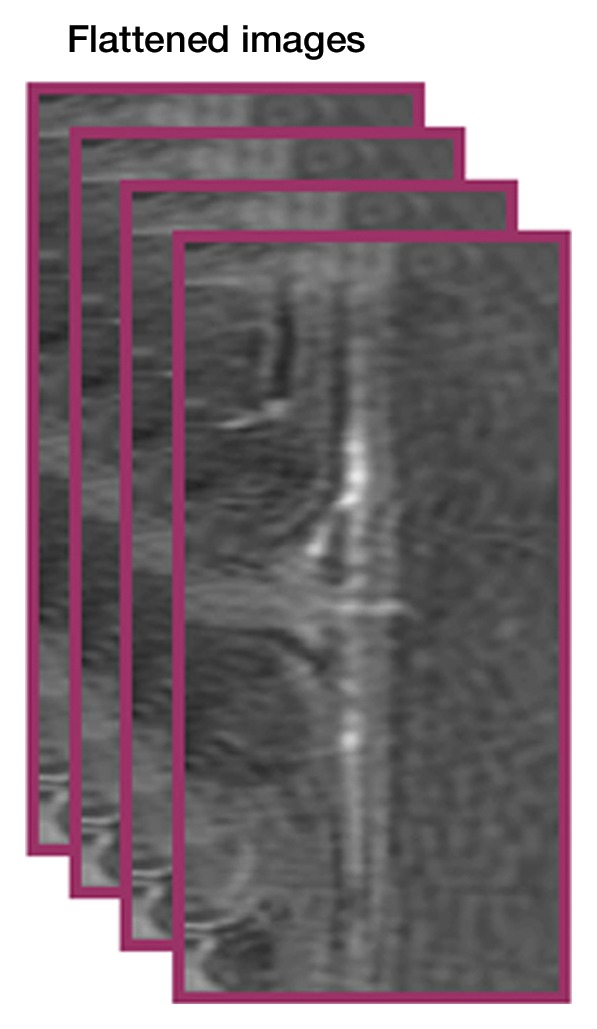
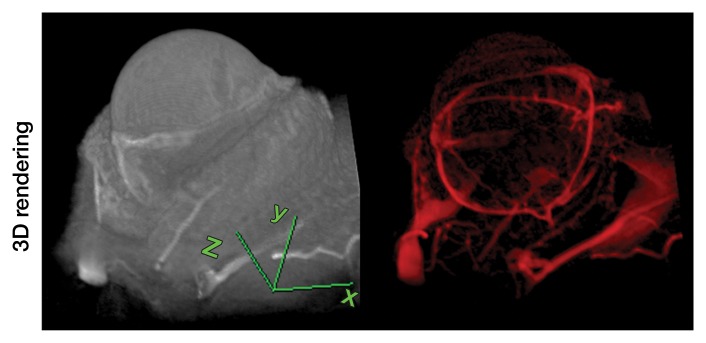
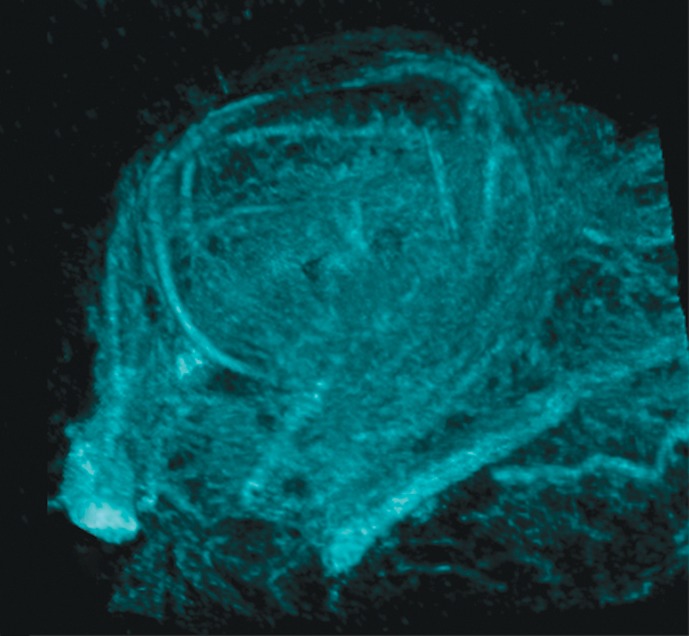
Materials and methods: Animal experiments were performed with institutional Animal Care Committee approval. MR microangiography (resolution, 84×84×84 μm or 42×42×84 μm) of the rat eye (eight rats) was performed by using a custom-made small circular surface coil with an 11.7-T MR unit before and after monocrystalline iron oxide nanoparticle (MION) injection. MR microangiography measurements were made during air, oxygen, and carbogen inhalation. From three-dimensional MR microangiography, the retina was virtually flattened to enable en face views of various retinal depths, including the retinal and choroidal vascular layers. Signal intensity changes within the retinal or choroidal arteries and veins associated with gas challenges were analyzed. Statistical analysis was performed by using paired t tests, with P<.05 considered to indicate a significant difference. Bonferroni correction was used to adjust for multiple comparisons.

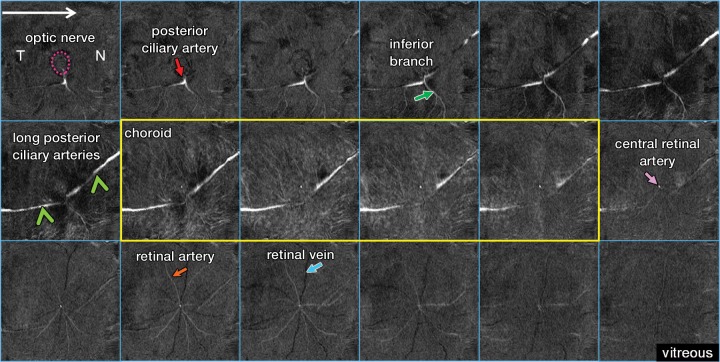
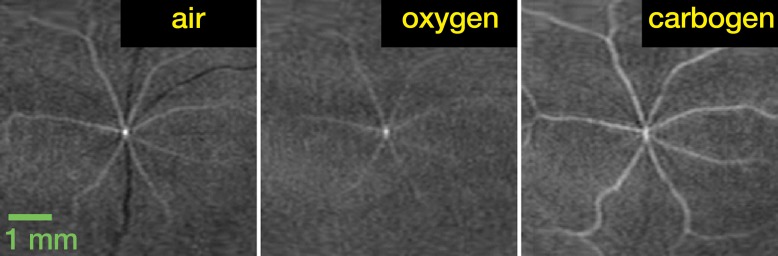
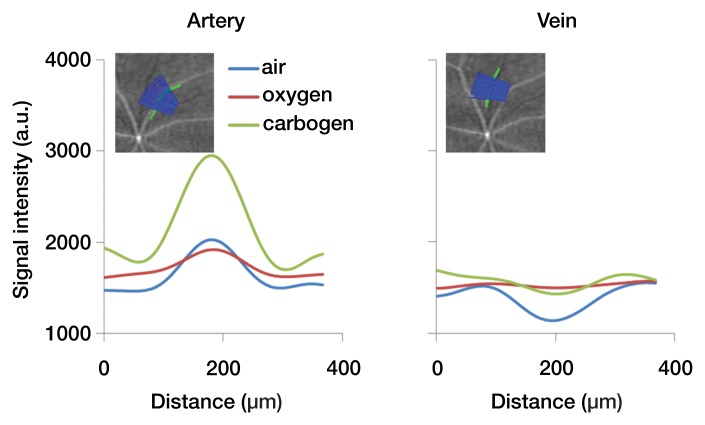
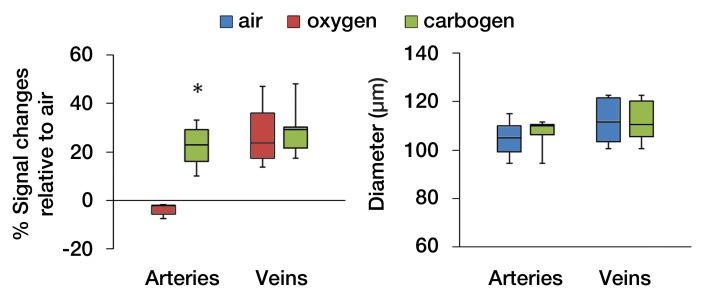
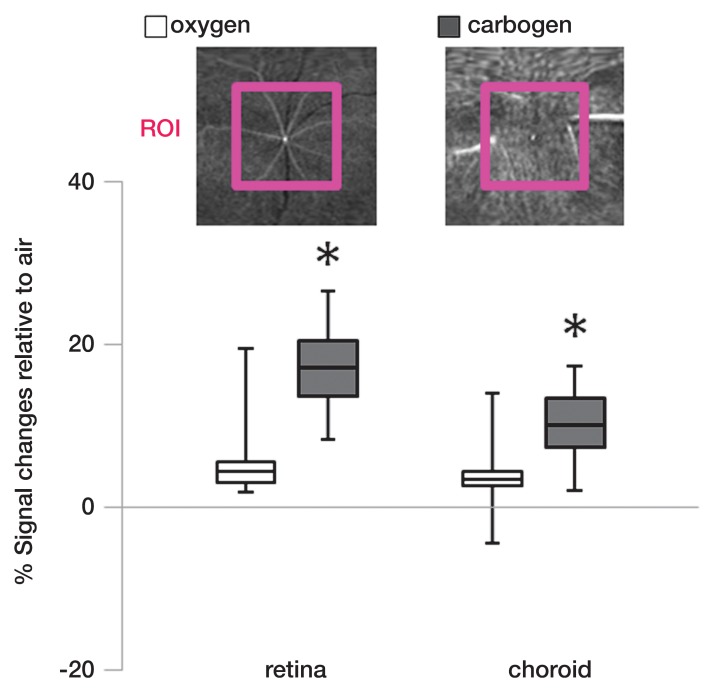
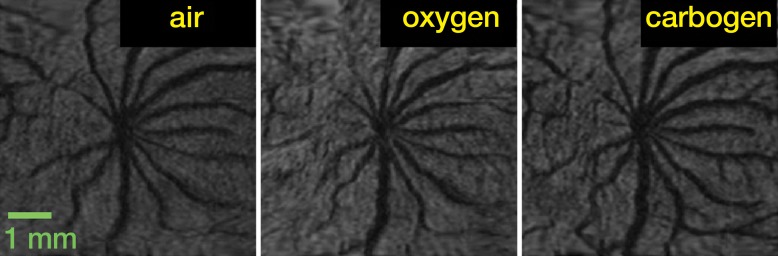
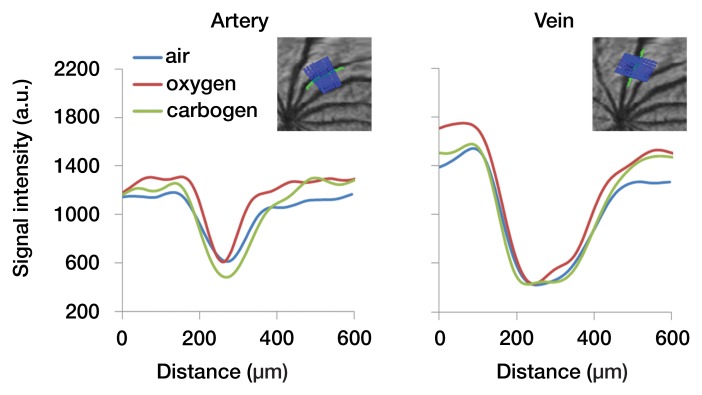
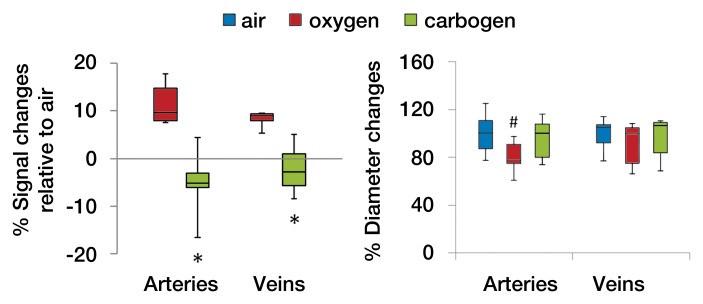
Results: The central retinal artery, long posterior ciliary arteries, and choroidal vasculature could be distinguished on MR microangiograms of the eye. With MR microangiography, retinal arteries and veins could be distinguished on the basis of blood oxygen level-dependent contrast. Carbogen inhalation-enhanced MR microangiography signal intensity in both the retina (P=.001) and choroid (P=.027) compared with oxygen inhalation. Carbogen inhalation showed significantly higher signal intensity changes in the retinal arteries (P=.001, compared with oxygen inhalation), but not in the veins (P=.549). With MION administration, MR microangiography depicted retinal arterial vasoconstriction when the animals were breathing oxygen (P=.02, compared with animals breathing air).

Conclusion: MR microangiography of the eye allows depth-resolved imaging of small angiographic details of the ocular circulation. This approach may prove useful in studying microvascular pathologic findings and neurovascular dysfunction in the eye and retina.


Figures

Figure 1a:
Figure 1a:
Procedure for flattening the retina. MR images (26/4.3) show steps as follows: (a) Coronal oblique image. From a central section (outlined in red), the retinal edge (white curve) is found. The 3D images are resectioned at the locations indicated by the blue lines. (b) Three-dimensional oblique view of the resectioning. The 3D retinal surface is shown in green. A single section of the resectioned data is shown (outlined in blue). (c) Oblique image is from same section as a. The resectioned data (green curve) indicate the retinal surface. From each section, profiles perpendicular to the retinal surface are found (purple lines). (d) Spatially warped image is from same section as a. The profiles produce a linearized representation of the retina (outlined in purple) from each section, resulting in a 3D flattened image of the retina.
Figure 1b:
Figure 1b:
Procedure for flattening the retina. MR images (26/4.3) show steps as follows: (a) Coronal oblique image. From a central section (outlined in red), the retinal edge (white curve) is found. The 3D images are resectioned at the locations indicated by the blue lines. (b) Three-dimensional oblique view of the resectioning. The 3D retinal surface is shown in green. A single section of the resectioned data is shown (outlined in blue). (c) Oblique image is from same section as a. The resectioned data (green curve) indicate the retinal surface. From each section, profiles perpendicular to the retinal surface are found (purple lines). (d) Spatially warped image is from same section as a. The profiles produce a linearized representation of the retina (outlined in purple) from each section, resulting in a 3D flattened image of the retina.
Figure 1c:
Figure 1c:
Procedure for flattening the retina. MR images (26/4.3) show steps as follows: (a) Coronal oblique image. From a central section (outlined in red), the retinal edge (white curve) is found. The 3D images are resectioned at the locations indicated by the blue lines. (b) Three-dimensional oblique view of the resectioning. The 3D retinal surface is shown in green. A single section of the resectioned data is shown (outlined in blue). (c) Oblique image is from same section as a. The resectioned data (green curve) indicate the retinal surface. From each section, profiles perpendicular to the retinal surface are found (purple lines). (d) Spatially warped image is from same section as a. The profiles produce a linearized representation of the retina (outlined in purple) from each section, resulting in a 3D flattened image of the retina.
Figure 1d:
Figure 1d:
Procedure for flattening the retina. MR images (26/4.3) show steps as follows: (a) Coronal oblique image. From a central section (outlined in red), the retinal edge (white curve) is found. The 3D images are resectioned at the locations indicated by the blue lines. (b) Three-dimensional oblique view of the resectioning. The 3D retinal surface is shown in green. A single section of the resectioned data is shown (outlined in blue). (c) Oblique image is from same section as a. The resectioned data (green curve) indicate the retinal surface. From each section, profiles perpendicular to the retinal surface are found (purple lines). (d) Spatially warped image is from same section as a. The profiles produce a linearized representation of the retina (outlined in purple) from each section, resulting in a 3D flattened image of the retina.
Figure 2a:
Figure 2a:
Three-dimensional MR microangiography and volume rendering reveal vascular morphologic features of a rat eye. (a) Oblique axial MR images (26/4.3) perpendicular to the optic nerve head show the retinal vessels (blue arrows) branching from the central retinal artery, with LPCAs (green arrowheads). (b) Oblique sagittal MR views (26/4.3) parallel to the optic nerve head of the eye depict the central retinal artery, choroid (yellow arrowheads), and the retinal vessels (blue arrows). (c) Volume-rendered 3D images show eyeball at left and vascular structure at right without MION injection. x = Readout direction, y = first phase-encoding direction, z = second phase-encoding direction. (d) Volume-rendered 3D image of the ocular BV. Post-MION = after MION injection, Pre-MION = before MION injection, green arrowheads = LPCAs, red arrows = posterior ciliary artery.
Figure 2b:
Figure 2b:
Three-dimensional MR microangiography and volume rendering reveal vascular morphologic features of a rat eye. (a) Oblique axial MR images (26/4.3) perpendicular to the optic nerve head show the retinal vessels (blue arrows) branching from the central retinal artery, with LPCAs (green arrowheads). (b) Oblique sagittal MR views (26/4.3) parallel to the optic nerve head of the eye depict the central retinal artery, choroid (yellow arrowheads), and the retinal vessels (blue arrows). (c) Volume-rendered 3D images show eyeball at left and vascular structure at right without MION injection. x = Readout direction, y = first phase-encoding direction, z = second phase-encoding direction. (d) Volume-rendered 3D image of the ocular BV. Post-MION = after MION injection, Pre-MION = before MION injection, green arrowheads = LPCAs, red arrows = posterior ciliary artery.
Figure 2c:
Figure 2c:
Three-dimensional MR microangiography and volume rendering reveal vascular morphologic features of a rat eye. (a) Oblique axial MR images (26/4.3) perpendicular to the optic nerve head show the retinal vessels (blue arrows) branching from the central retinal artery, with LPCAs (green arrowheads). (b) Oblique sagittal MR views (26/4.3) parallel to the optic nerve head of the eye depict the central retinal artery, choroid (yellow arrowheads), and the retinal vessels (blue arrows). (c) Volume-rendered 3D images show eyeball at left and vascular structure at right without MION injection. x = Readout direction, y = first phase-encoding direction, z = second phase-encoding direction. (d) Volume-rendered 3D image of the ocular BV. Post-MION = after MION injection, Pre-MION = before MION injection, green arrowheads = LPCAs, red arrows = posterior ciliary artery.
Figure 2d:
Figure 2d:
Three-dimensional MR microangiography and volume rendering reveal vascular morphologic features of a rat eye. (a) Oblique axial MR images (26/4.3) perpendicular to the optic nerve head show the retinal vessels (blue arrows) branching from the central retinal artery, with LPCAs (green arrowheads). (b) Oblique sagittal MR views (26/4.3) parallel to the optic nerve head of the eye depict the central retinal artery, choroid (yellow arrowheads), and the retinal vessels (blue arrows). (c) Volume-rendered 3D images show eyeball at left and vascular structure at right without MION injection. x = Readout direction, y = first phase-encoding direction, z = second phase-encoding direction. (d) Volume-rendered 3D image of the ocular BV. Post-MION = after MION injection, Pre-MION = before MION injection, green arrowheads = LPCAs, red arrows = posterior ciliary artery.
Figure 3:
Figure 3:
Flattened anatomy of the posterior eye. From left to right and top to bottom, MR images (40/4.3) show sections from posterior at the top left (optic nerve) to anterior at the bottom right (vitreous). The inferior branch (green arrow) refers to the inferior branch of the posterior ciliary artery. N = nasal side, T = temporal side, purple dotted circle = optic nerve, yellow outline = choroidal vascular layer.
Figure 4a:
Figure 4a:
Time-of-flight MR angiographic images (26/4.3) of retinal vascular layer during gas challenges. (a) Images show flattened vascular structures during air, oxygen, and carbogen inhalation. (b) Graphs show corresponding vessel profiles from single animal. Insets: Flattened MR images of retinal vascular layer show analyzed segment. (c) Graphs show vessel diameter and peak signal intensity changes in retinal vessels associated with gas challenges (n = 7). * = P < .05, significantly different from oxygen inhalation.
Figure 4b:
Figure 4b:
Time-of-flight MR angiographic images (26/4.3) of retinal vascular layer during gas challenges. (a) Images show flattened vascular structures during air, oxygen, and carbogen inhalation. (b) Graphs show corresponding vessel profiles from single animal. Insets: Flattened MR images of retinal vascular layer show analyzed segment. (c) Graphs show vessel diameter and peak signal intensity changes in retinal vessels associated with gas challenges (n = 7). * = P < .05, significantly different from oxygen inhalation.
Figure 4c:
Figure 4c:
Time-of-flight MR angiographic images (26/4.3) of retinal vascular layer during gas challenges. (a) Images show flattened vascular structures during air, oxygen, and carbogen inhalation. (b) Graphs show corresponding vessel profiles from single animal. Insets: Flattened MR images of retinal vascular layer show analyzed segment. (c) Graphs show vessel diameter and peak signal intensity changes in retinal vessels associated with gas challenges (n = 7). * = P < .05, significantly different from oxygen inhalation.
Figure 5:
Figure 5:
Region-of-interest (ROI) analysis of the signal intensity changes in the retinal and choroidal vascular layers during gas challenges (n = 7). Insets: Flattened MR images (26/4.3) of the retinal and choroidal vascular layer show region of interest. * = P < .05, significantly different from oxygen inhalation.
Figure 6a:
Figure 6a:
MR angiographic images (26/4.3) of the retinal vascular layer during gas challenges with 30 mg of iron per kilogram MION injection. (a) Images show flattened vascular structures during air, oxygen, and carbogen inhalation. Data were from the same subject as shown in Figure 4. (b) Graphs show linearized vessel profiles during air, oxygen, and carbogen inhalation. Insets: Flattened MR images of the retinal vascular layer show the analyzed segment. (c) Graphs show vessel diameter and signal intensity changes in the retinal vessels associated with gas challenges (n = 6). * = P < .05, significantly different from oxygen inhalation. # = P < .025, significantly different from air inhalation.
Figure 6b:
Figure 6b:
MR angiographic images (26/4.3) of the retinal vascular layer during gas challenges with 30 mg of iron per kilogram MION injection. (a) Images show flattened vascular structures during air, oxygen, and carbogen inhalation. Data were from the same subject as shown in Figure 4. (b) Graphs show linearized vessel profiles during air, oxygen, and carbogen inhalation. Insets: Flattened MR images of the retinal vascular layer show the analyzed segment. (c) Graphs show vessel diameter and signal intensity changes in the retinal vessels associated with gas challenges (n = 6). * = P < .05, significantly different from oxygen inhalation. # = P < .025, significantly different from air inhalation.
Figure 6c:
Figure 6c:
MR angiographic images (26/4.3) of the retinal vascular layer during gas challenges with 30 mg of iron per kilogram MION injection. (a) Images show flattened vascular structures during air, oxygen, and carbogen inhalation. Data were from the same subject as shown in Figure 4. (b) Graphs show linearized vessel profiles during air, oxygen, and carbogen inhalation. Insets: Flattened MR images of the retinal vascular layer show the analyzed segment. (c) Graphs show vessel diameter and signal intensity changes in the retinal vessels associated with gas challenges (n = 6). * = P < .05, significantly different from oxygen inhalation. # = P < .025, significantly different from air inhalation.

References

    1. Geiser MH, Riva CE, Dorner GT, Diermann U, Luksch A, Schmetterer L. Response of choroidal blood flow in the foveal region to hyperoxia and hyperoxia-hypercapnia. Curr Eye Res 2000;21(2):669–676 - PubMed
    1. Cheng H, Nair G, Walker TA, et al. Structural and functional MRI reveals multiple retinal layers. Proc Natl Acad Sci U S A 2006;103(46):17525–17530 - PMC - PubMed
    1. Preussner PR, Richard G, Darrelmann O, Weber J, Kreissig I. Quantitative measurement of retinal blood flow in human beings by application of digital image-processing methods to television fluorescein angiograms. Graefes Arch Clin Exp Ophthalmol 1983;221(3):110–112 - PubMed
    1. Guyer DR, Yannuzzi LA, Slakter JS, Sorenson JA, Orlock S. The status of indocyanine-green videoangiography. Curr Opin Ophthalmol 1993;4(3):3–6 - PubMed
    1. Lorentz K, Zayas-Santiago A, Tummala S, Kang Derwent JJ. Scanning laser ophthalmoscope-particle tracking method to assess blood velocity during hypoxia and hyperoxia. Adv Exp Med Biol 2008;614:253–261 - PubMed

Publication types

MeSH terms