. 2012 Aug;36(8):1330-9.
doi: 10.1111/j.1530-0277.2012.01749.x. Epub 2012 Apr 23.

Ethanol drinking microstructure of a high drinking in the dark selected mouse line

Affiliations

Ethanol drinking microstructure of a high drinking in the dark selected mouse line

Amanda M Barkley-Levenson et al. Alcohol Clin Exp Res. 2012 Aug.

Abstract

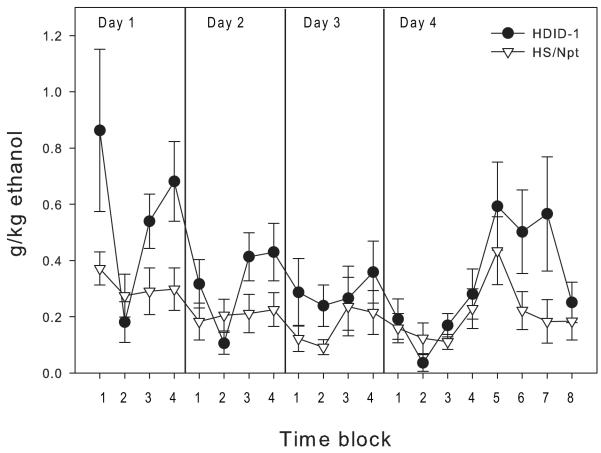
Background: The High Drinking in the Dark (HDID) selected mouse line was bred for high blood ethanol (EtOH) concentration (BEC) following the limited access drinking in the dark (DID) test and is a genetic animal model of binge-like drinking. This study examines the microstructure of EtOH drinking in these mice and their control line during 3 versions of the DID test to determine how drinking structure differences might relate to overall intake and BEC.

Methods: Male mice from the HDID-1 replicate line and HS/Npt progenitor stock were tested in separate experiments on 2- and 4-day versions of the DID test, and on a 2-day 2-bottle choice DID test with 20% EtOH and water. Testing took place in home cages connected to a continuous fluid intake monitoring system, and drinking during the DID test was analyzed for drinking microstructure.

Results: HDID-1 mice had more drinking bouts, shorter interbout interval, larger bout size, greater total EtOH intake, and higher BECs than HS/Npt mice on the second day of the 2-day DID test. The 4-day DID test showed greater bout size, total EtOH intake, and BEC in the HDID-1 mice than the HS/Npt mice. Total EtOH intake and BECs for the HDID-1 mice in the DID tests averaged 2.6 to 3.0 g/kg and 0.4 to 0.5 mg/ml, respectively. The 2-bottle choice test showed no genotype differences in drinking microstructure or total consumption but did show greater preference for the EtOH solution in HDID-1 mice than HS/Npt.

Conclusions: These results suggest that inherent differences in EtOH drinking structure between the HDID-1 and HS/Npt mice, especially the larger bout size in the HDID-1 mice, contribute to the difference in intake during the standard DID test.


Figures

Fig. 1
Fig. 1
Total g/kg ethanol intake per 30 min time block during the 2-day DID test. Mean ± SEM is shown. n=18 per genotype.
Fig. 2
Fig. 2
Summary of drinking variables on Day 2 of the 2-day DID test. Mean values were calculated for each genotype over the entire 4 hour drinking period. Variables are number of bouts (A), interbout interval (B), bout duration (C), bout size (D), total g/kg ethanol intake (E), and BEC after 4 hr of drinking (F). Asterisks denote values significantly different from HS/Npt. * indicates p<0.05 and ** indicates p<0.01. n=18 per genotype.
Fig. 3
Fig. 3
Total g/kg ethanol intake per 30 min time block during the 4-day DID test. Mean ± SEM is shown. n=17-18 per genotype.
Fig. 4
Fig. 4
Summary of drinking variables on Day 4 of the 4-day DID test. Mean values were calculated for each genotype over the entire 4 hr drinking period. Variables are number of bouts (A), interbout interval (B), bout duration (C), bout size (D), total g/kg ethanol intake (E), and BEC after 4 hr of drinking (F). Asterisks denote values significantly different from HS/Npt. * indicates p<0.05 and ** indicates p<0.01. n=17-18 per genotype.
Fig. 5
Fig. 5
Panel A shows total mL/kg ethanol intake per 30 min time block during Days 1 and 2 of the two-bottle choice DID test and panel B shows total mL/kg water consumption. Mean ± SEM is shown. The inset of panel A shows total g/kg dose of ethanol consumed per 30 min time block across both days. n=12 per genotype.
Fig. 6
Fig. 6
Summary of ethanol drinking variables on Day 2 of the two-bottle choice DID test. Mean values were calculated for each genotype over the entire 4 hr period. Variables are number of bouts (A), interbout interval (B), bout duration (C), bout size in mL/kg (D), and total mL/kg 20% ethanol solution intake (E). n=12 per genotype.
Fig. 7
Fig. 7
Summary of water drinking variables on Day 2 of the two-bottle choice DID test. Mean values were calculated for each genotype over the entire 4 hr period. Variables are number of bouts (A), interbout interval (B), bout duration (C), bout size in mL/kg (D), and total mL/kg intake (E). n=12 per genotype.
Fig. 8
Fig. 8
Mean preference for the 20% ethanol solution as a percent of total fluid consumption (A) and total fluid consumption in mL (B) over 2 hr on Day 1 and 4 hr on Day 2. Asterisk denotes statistically significant effect of genotype. * indicates p<0.05 and ** indicates p<0.01. n=12 per genotype.

Similar articles

Cited by

References

    1. Armstrong S. A chronometric approach to the study of feeding behavior. Neuroscience & Biobehavioral Reviews. 1980;4(1):27–53. - PubMed
    1. Bobak M, Room R, Pikhart H, Kubinova R, Malyutina S, Pajak A, Kurilovitch S, Topor R, Nikitin Y, Marmot M. Contribution of drinking patterns to differences in rates of alcohol related problems between three urban populations. J Epidemiol Community Health. 2004;58(3):238–242. - PMC - PubMed
    1. Boughter JD, Jr, Baird J-P, Bryant J, St John SJ, Heck D. C57BL/6J and DBA/2J mice vary in lick rate and ingestive microstructure. Genes Brain Behav. 2007;6(7):619–627. - PubMed
    1. Canu ME, Carta D, Murgia E, Serra G, D’Aquila PS. Dopamine on D2-like receptors is involved in reward evaluation in water-deprived rats licking for NaCl and water. Pharmacol Biochem Behav. 2010;96(2):194–197. 2010. - PubMed
    1. Crabbe JC, Metten P, Rhodes JS, Yu C-H, Brown LL, Phillips TJ, Finn DA. A line of mice selected for high blood ethanol concentrations shows drinking in the dark to intoxication. Biol Psychiatry. 2009;65(8):662–670. - PMC - PubMed

Publication types