

Factors associated with macular thickness in the COMET myopic cohort
- PMID: 22525127
- PMCID: PMC3348261
- DOI: 10.1097/OPX.0b013e318251293a
Factors associated with macular thickness in the COMET myopic cohort
Abstract
Purpose: To determine whether macular thickness is associated with ethnicity, gender, axial length (AL), and severity of myopia in a cohort of young adults from the Correction of Myopia Evaluation Trial (COMET).
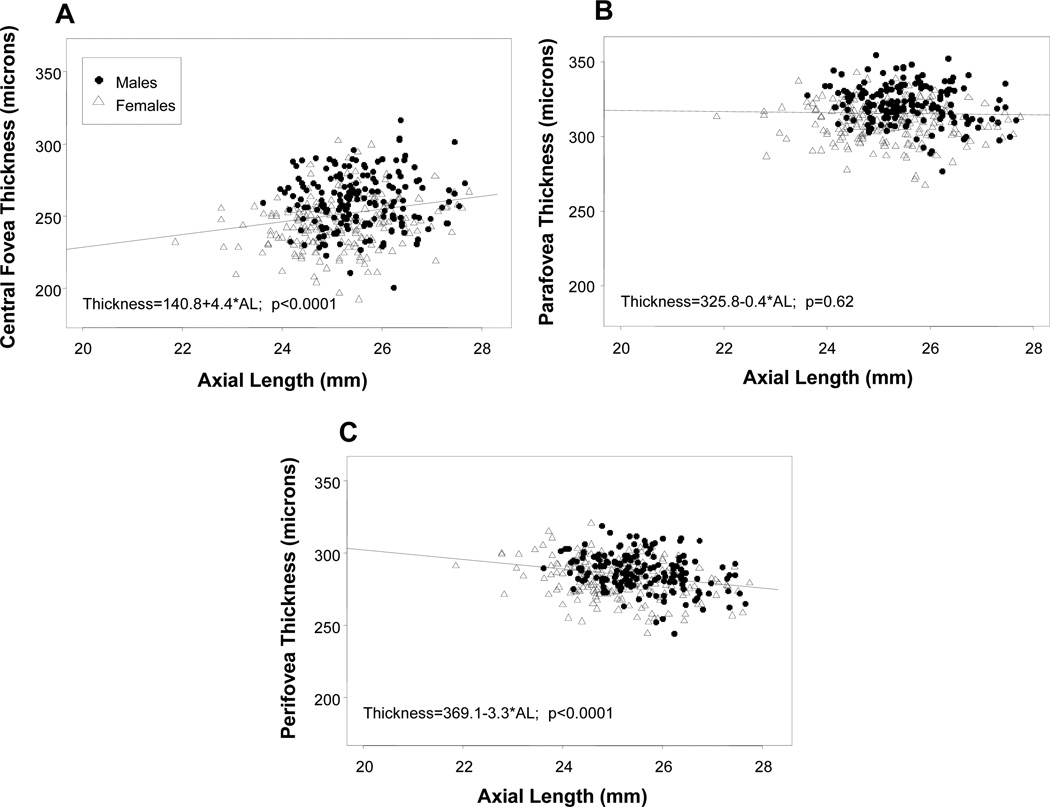
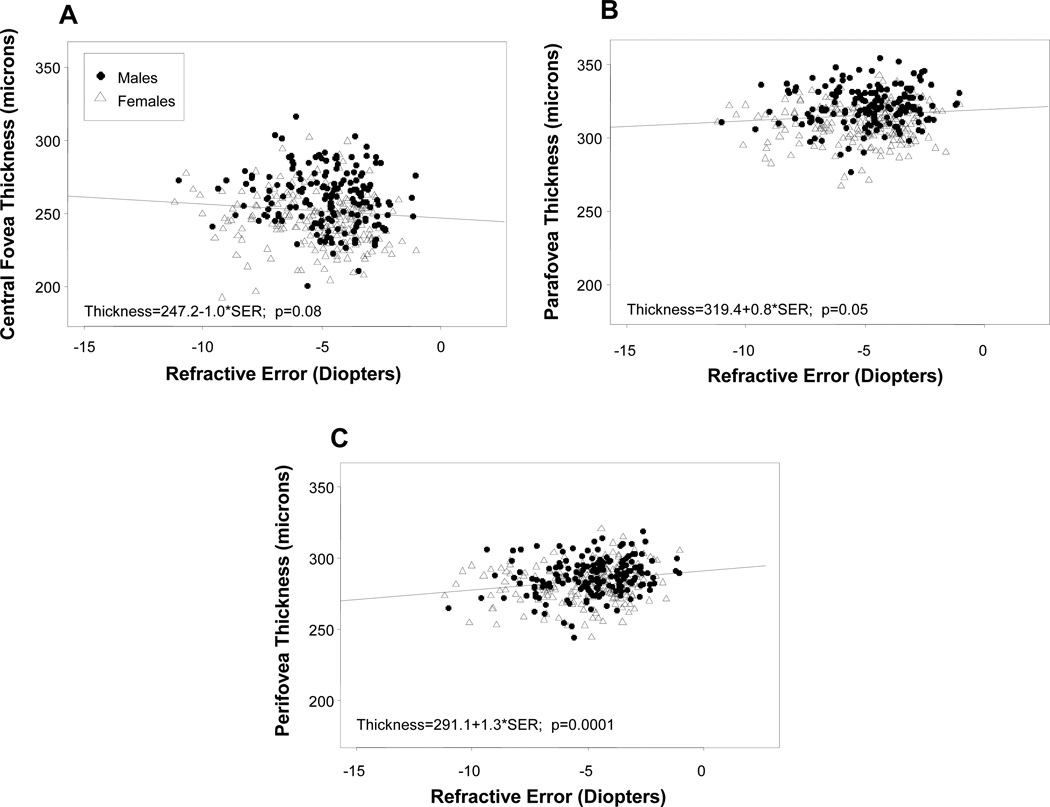
Methods: Eleven years after their baseline visit, 387/469 (83%) subjects returned for their annual visit. In addition to the protocol-specific measures of spherical equivalent refractive error (SER) and AL, high-resolution macular imaging also was performed with optical coherence tomography (RTVue). From these scans, full-thickness values for the central (1 mm), parafoveal (1 to 3 mm), and perifoveal (3 to 5 mm) annular regions were calculated. Gender, ethnicity, AL, and SER were examined for associations with macular thickness using univariate and multivariable linear regression analyses.
Results: In the 377 subjects with usable data (mean age = 21.0 ± 1.3 years), the mean SER ± SD was -5.0 ± 1.9 D and mean AL was 25.4 ± 0.9 mm. Mean foveal thickness was 252.0 ± 20.1 μm in the center, 315.6 ± 14.0 μm in the parafovea, and 284.4 ± 12.9 μm in the perifovea. In the best-fit multivariable model that adjusted for gender, ethnicity, and AL, females had significantly thinner maculas than males for all three regions (p < 0.0001), with the largest difference in the center (12.8 μm, 95% confidence interval: 9.2 to 16.4). The effect of ethnicity was strongest in the central fovea, with African-Americans, Asians, Hispanics, and mixed ethnic groups having thinner maculas than whites (all p values < 0.005). Increased AL was significantly associated with slightly thicker central foveas (p = 0.001) and thinner parafoveal (p = 0.02) and perifoveal (p < 0.0001) regions.
Conclusions: In this ethnically diverse cohort of moderate and high myopes, females and African-Americans were found to have the thinnest central foveas. Whether such thinning in the macula as a young adult is a risk factor for future disease remains to be determined.
Conflict of interest statement
None of the authors have conflicts of interest or financial disclosures.
Figures


References
-
- Buch H, Vinding T, La Cour M, Appleyard M, Jensen GB, Nielsen NV. Prevalence and causes of visual impairment and blindness among 9980 Scandinavian adults: the Copenhagen City Eye Study. Ophthalmology. 2004;111:53–61. - PubMed
-
- Saw SM, Gazzard G, Shih-Yen EC, Chua WH. Myopia and associated pathological complications. Ophthalmic Physiol Opt. 2005;25:381–391. - PubMed
-
- Vitale S, Sperduto RD, Ferris FL., 3rd Increased prevalence of myopia in the United States between 1971–1972 and 1999–2004. Arch Ophthalmol. 2009;127:1632–1639. - PubMed
-
- Kobayashi K, Ohno-Matsui K, Kojima A, Shimada N, Yasuzumi K, Yoshida T, Futagami S, Tokoro T, Mochizuki M. Fundus characteristics of high myopia in children. Jpn J Ophthalmol. 2005;49:306–311. - PubMed
-
- Hayashi K, Ohno-Matsui K, Shimada N, Moriyama M, Kojima A, Hayashi W, Yasuzumi K, Nagaoka N, Saka N, Yoshida T, Tokoro T, Mochizuki M. Long-term pattern of progression of myopic maculopathy: a natural history study. Ophthalmology. 2010;117:1595–1611. 611 e1–4. - PubMed
Publication types
MeSH terms
Grants and funding
LinkOut - more resources
Full Text Sources
