. 2012 Dec;64(6):649-66.
doi: 10.1007/s10616-012-9445-2. Epub 2012 Apr 18.

A new flow co-culture system for studying mechanobiology effects of pulse flow waves

Affiliations

A new flow co-culture system for studying mechanobiology effects of pulse flow waves

Devon Scott-Drechsel et al. Cytotechnology. 2012 Dec.

Abstract

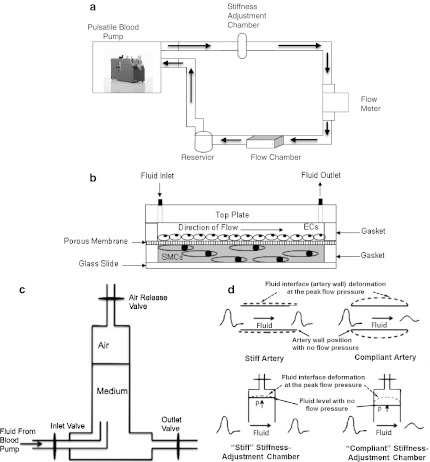
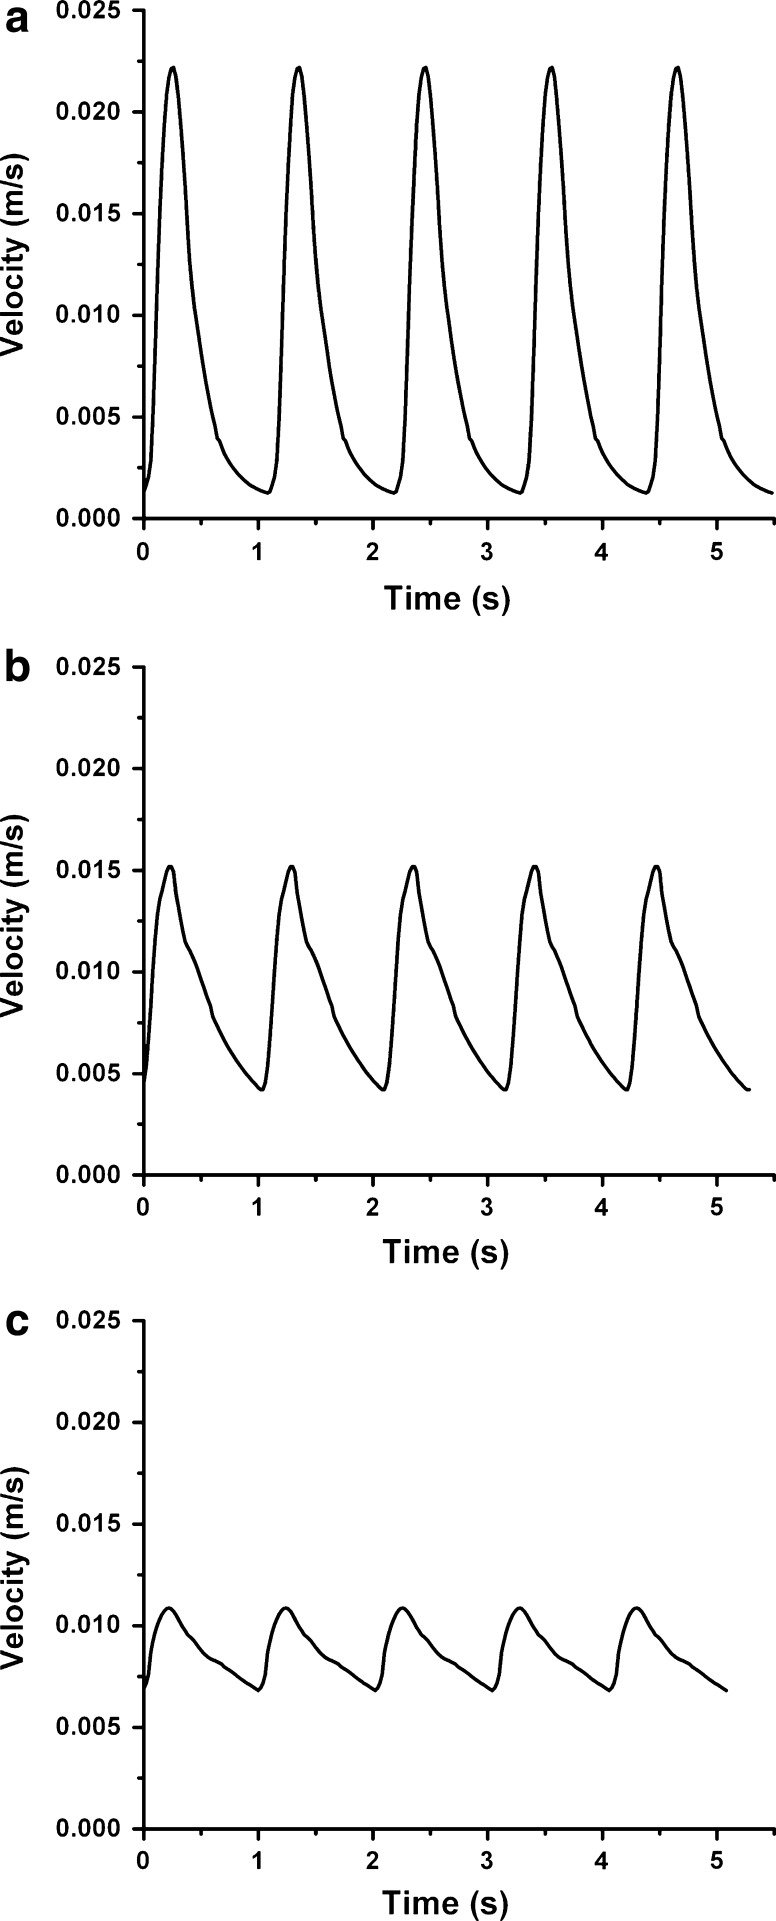
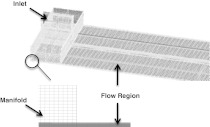
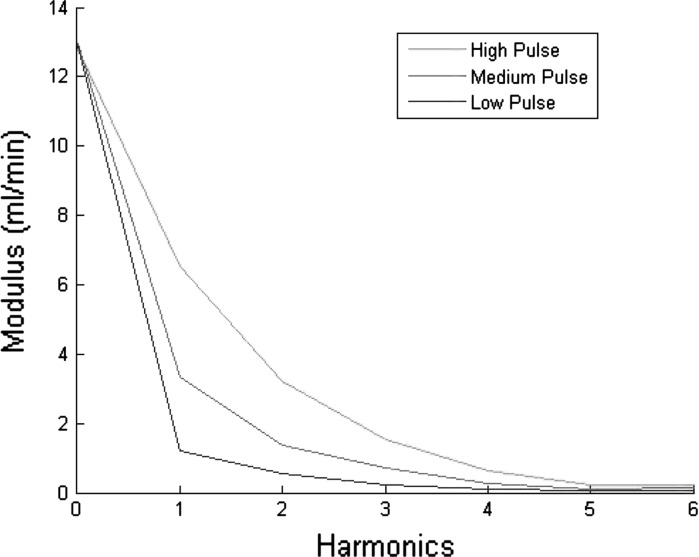
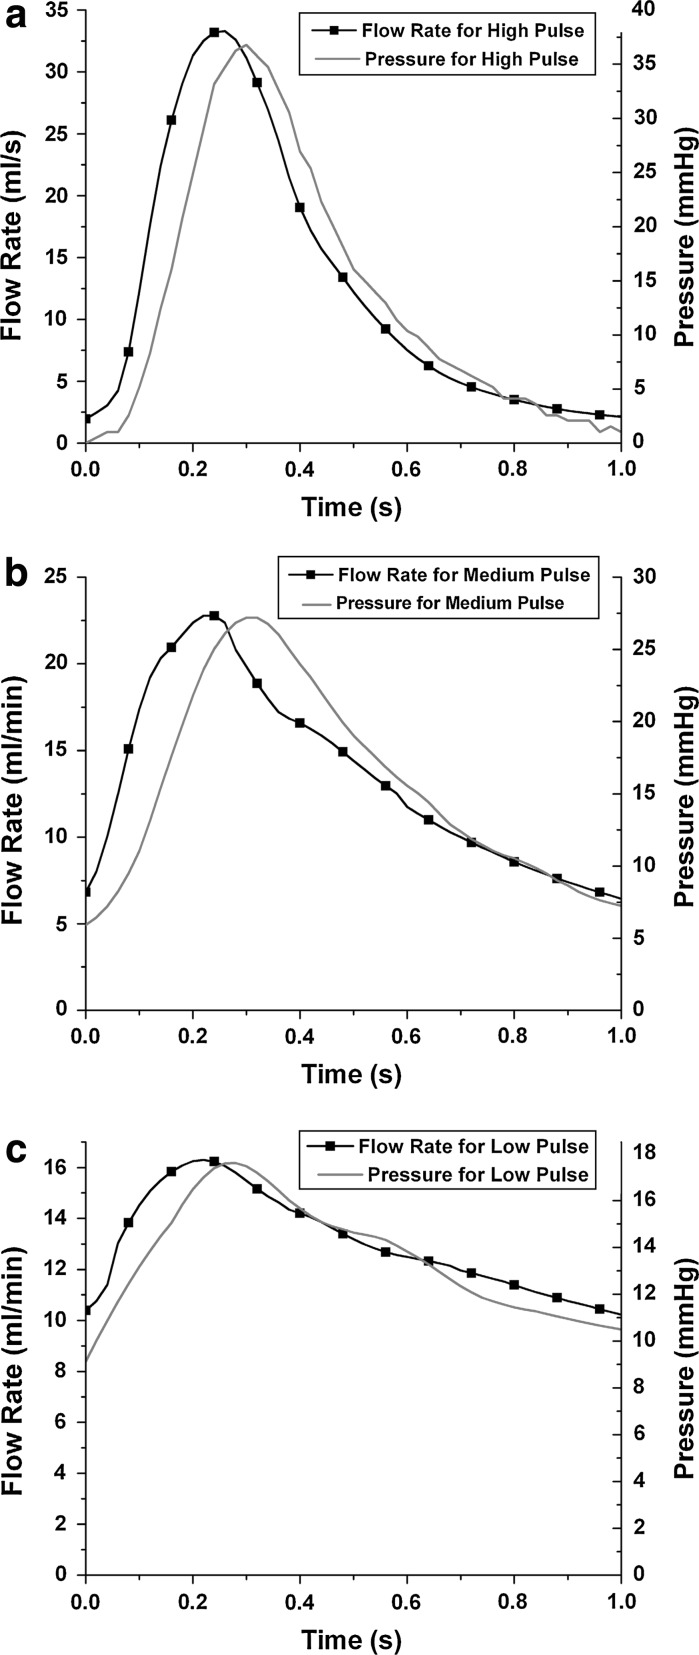
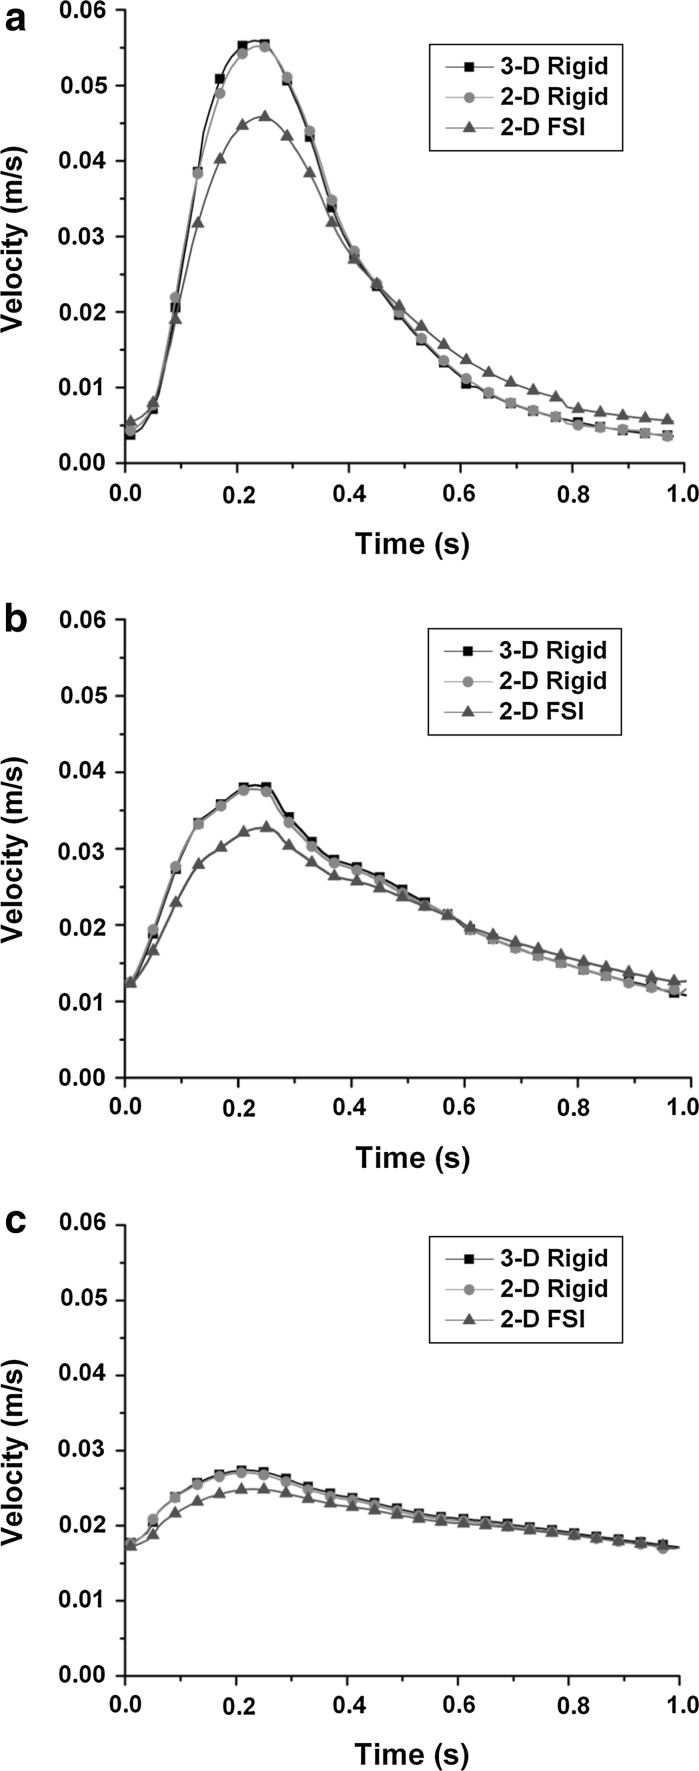
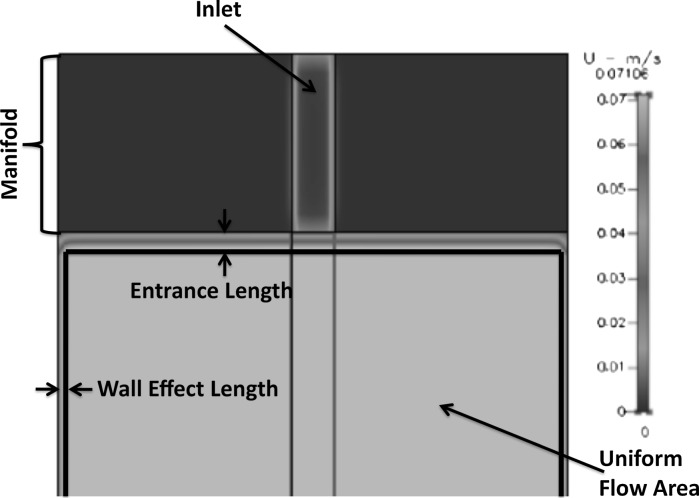
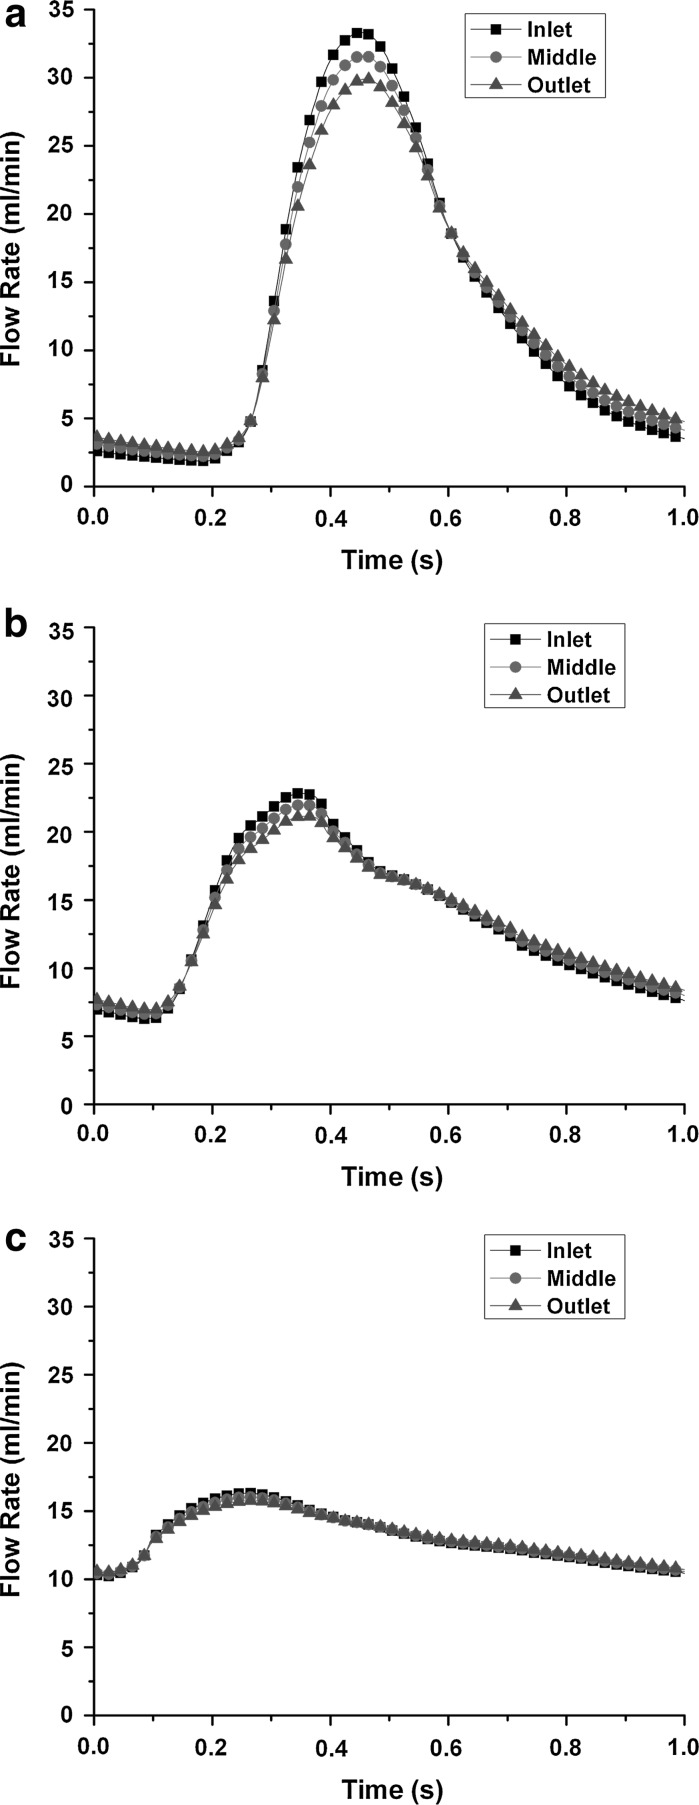
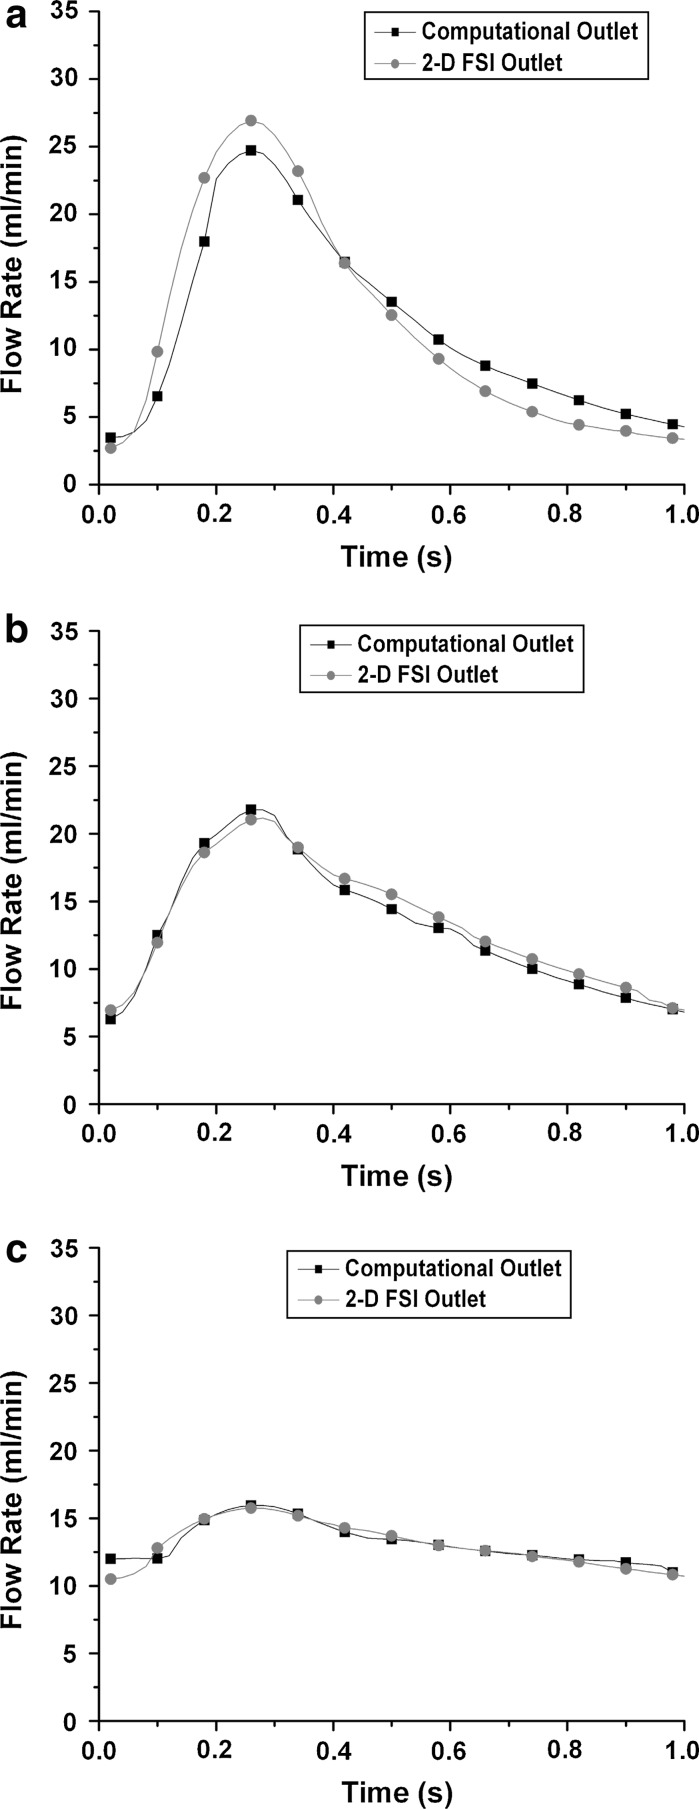
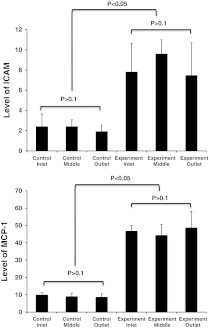
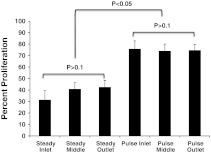
Artery stiffening is known as an important pathological change that precedes small vessel dysfunction, but underlying cellular mechanisms are still elusive. This paper reports the development of a flow co-culture system that imposes a range of arterial-like pulse flow waves, with similar mean flow rate but varied pulsatility controlled by upstream stiffness, onto a 3-D endothelial-smooth muscle cell co-culture. Computational fluid dynamics results identified a uniform flow area critical for cell mechanobiology studies. For validation, experimentally measured flow profiles were compared to computationally simulated flow profiles, which revealed percentage difference in the maximum flow to be <10, <5, or <1% for a high, medium, or low pulse flow wave, respectively. This comparison indicated that the computational model accurately demonstrated experimental conditions. The results from endothelial expression of proinflammatory genes and from determination of proliferating smooth muscle cell percentage both showed that cell activities did not vary within the identified uniform flow region, but were upregulated by high pulse flow compared to steady flow. The flow system developed and characterized here provides an important tool to enhance the understanding of vascular cell remodeling under flow environments regulated by stiffening.


Figures

Fig. 1
Fig. 1
Schematic illustrations of the flow system (a), the mimetic co-culture chamber (b), the stiffness-adjustment chamber (c), and function similarity between a stiffness-adjustment chamber and an upstream large artery (d). a The flow system demonstrates the flow circulation through different flow units. The arrows show the flow direction. b Illustration shows the cross-sectional view of a flow coculture chamber with EC seeded on a porous membrane in contact with SMCs embedded in a 3D collagen matrix. c The stiffness-adjustment chamber has an air release valve for adjustments of liquid/air ratio as well as inlet and outlet valves allowing medium to flow through the chamber. Air in the chamber can absorb high pulse energy and reduce pulsatility of the flow wave. d An illustration shows how the stiffness-adjustment chamber simulates the elastic function of the upstream elastic artery. The chamber is a representative of the upstream artery in terms of its flow modulation function. A “stiff” chamber containing little air represents a stiff artery, which can barely expand at peak flow pressure resulting in an unmodified high pulse flow wave at the exit of the chamber. A “compliant” chamber characterized by a high air-to-liquid ratio represents a normal elastic artery, which is capable of undergoing large expansion under the peak (systolic) flow pressure, thus resulting in a dampened flow. The interface expansion shows moving of the fluid position in the flow chamber or the artery wall under the peak (systolic) flow pressure
Fig. 2
Fig. 2
The three inlet velocity time history profiles used in this study. Each graph displays a different velocity profile for high (a), medium (b), and low (c) pulsatility
Fig. 3
Fig. 3
The computational grid for the 3-D rigid flow chamber. The grid is refined until there is less than a 1% difference in the velocity values. Half the chamber is modeled including the inlet where fluid enters the chamber, and the manifold where fluid expands across the width of the chamber
Fig. 4
Fig. 4
Spectral analysis of the high, medium, and low pulse waveforms with harmonic modulus. The harmonic modulus shows the frequency component of the flow waveform for comparisons
Fig. 5
Fig. 5
Flow waves and pressure waves for the high (a), medium (b), and low (c) pulse flow conditions
Fig. 6
Fig. 6
Comparisons of velocity profiles generated by 3-D rigid, 2-D rigid, and 2-D FSI computational models. It is shown that the 3-D and 2-D rigid models result in similar waveforms for high (a), medium (b) and low (c) pulse waves
Fig. 7
Fig. 7
The velocity color map (output from the 2-D FSI model) shows the velocity change throughout the channel and shows the entrance length to uniform velocity and the effects of the sidewalls and the uniform flow area. The uniform velocity region is outlined. In this region, the pulse flow velocity is constant over the time, represented by the same color throughout. A color change at the side walls and at the entrance of the chamber indicates that the pulse flow velocity decreases in those regions which are not included in the identified region for cell analysis. (Color figure online)
Fig. 8
Fig. 8
Spatial variations of flow waves. Flow time-history waves for the three pulse flow conditions, high (a), medium (b), low (c), were tested in three regions of the chamber, near the inlet, in the middle of the channel, and near the exit of the 2-D compliant model. These flow waves indicate that pulse flow is not changing in the identified region
Fig. 9
Fig. 9
Comparisons of the outlet velocity waves between the computation and experiment results for high (a), medium (b) and low (c) pulse flow conditions. This verifies the computation model, showing a small but expectable <10% deviation between experiment and computation
Fig. 10
Fig. 10
ICAM-1 and MCP-1 mRNA expressions in ECs subjected to flow. Polymerase chain reaction results demonstrate that ECs in the CFD-identified uniform region showed similar ICAM-1 and MCP-1 mRNA expressions. Also, there is a significant difference in these expressions between semi-steady flow (control) and pulse flow (experiment)
Fig. 11
Fig. 11
SMC PCNA expression under flow. Results on PCNA expressions by SMC demonstrate that cells in the CFD-identified uniform region showed similar proliferation in 10% serum medium. But there is a significant difference in SMC proliferation between the co-culture under semi-steady flow and that under pulse flow

References

    1. Berger RMF, Cromme-Dijkhuis AH, Hop CJ, Kruit MN, Hess J. Pulmonary arterial wall distensibility assessed by intravascular ultrasound in children with “congenital heart disease an indicator for pulmonary vascular disease?”. Chest. 2002;122:549–557. doi: 10.1378/chest.122.2.549. - DOI - PubMed
    1. Bjork TR. Transmural flow bioreactor for vascular tissue engineering. Biotechnol Bioeng. 2009;104(6):1197–1206. doi: 10.1002/bit.22475. - DOI - PMC - PubMed
    1. Chesler NC, Thompson-Figueroa J, Millburne K. Measurements of mouse pulmonary artery biomechanics. J Biomech Eng. 2004;126:309–314. doi: 10.1115/1.1695578. - DOI - PubMed
    1. Cheung N, Sharrett AR, Klein R, Criqui MH, Islam FM, Macura KJ, Cotch MF, Klein BE, Wong TY. Aortic distensibility and retinal arteriolar narrowing: the multiethnic study of atherosclerosis. Hypertension. 2007;50:617–622. doi: 10.1161/HYPERTENSIONAHA.107.091926. - DOI - PubMed
    1. Chien S. Mechanotransduction and endothelial cell homeostasis: the wisdom of the cell. Am J Physiol Heart Circ Physiol. 2007;292:H1209–H1224. doi: 10.1152/ajpheart.01047.2006. - DOI - PubMed