. 2012 Jun 15;590(12):2897-915.
doi: 10.1113/jphysiol.2012.232157. Epub 2012 Apr 23.

C1 neurons excite locus coeruleus and A5 noradrenergic neurons along with sympathetic outflow in rats

Affiliations

C1 neurons excite locus coeruleus and A5 noradrenergic neurons along with sympathetic outflow in rats

S B Abbott et al. J Physiol. .

Abstract

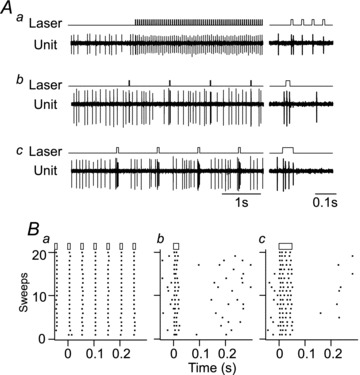
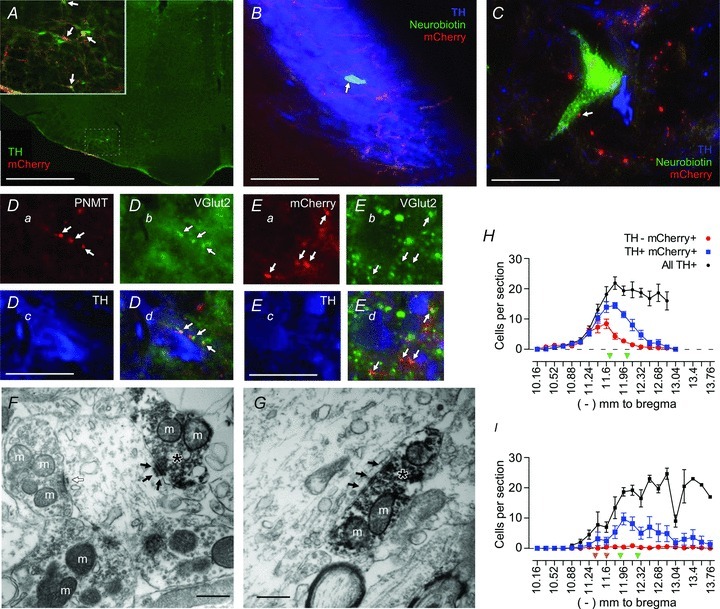
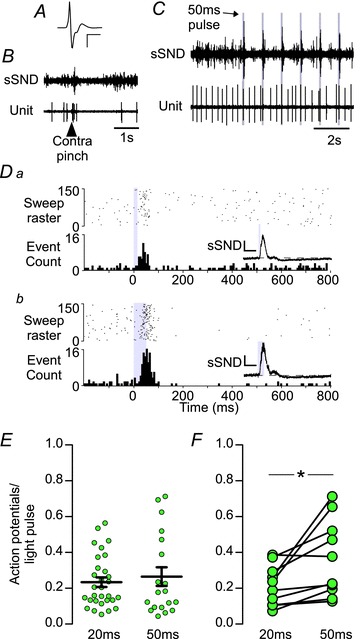
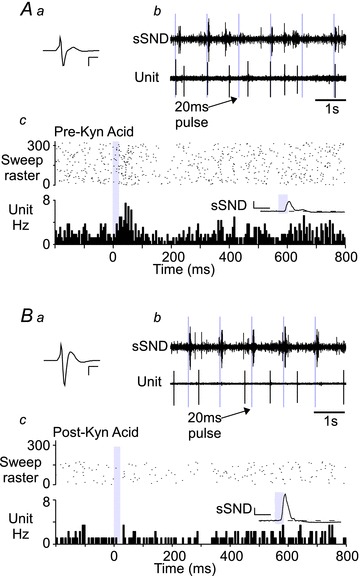
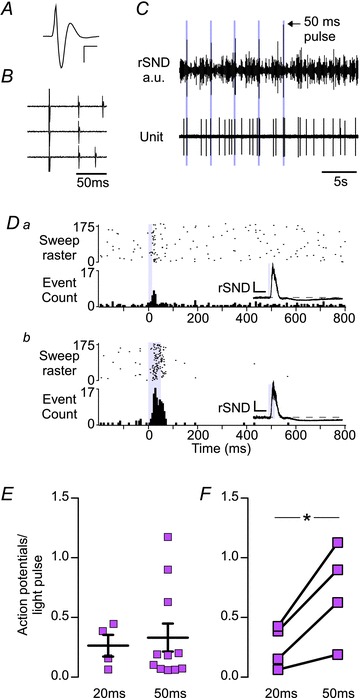
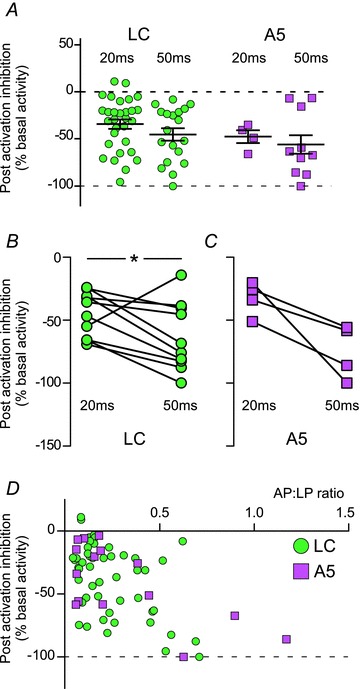
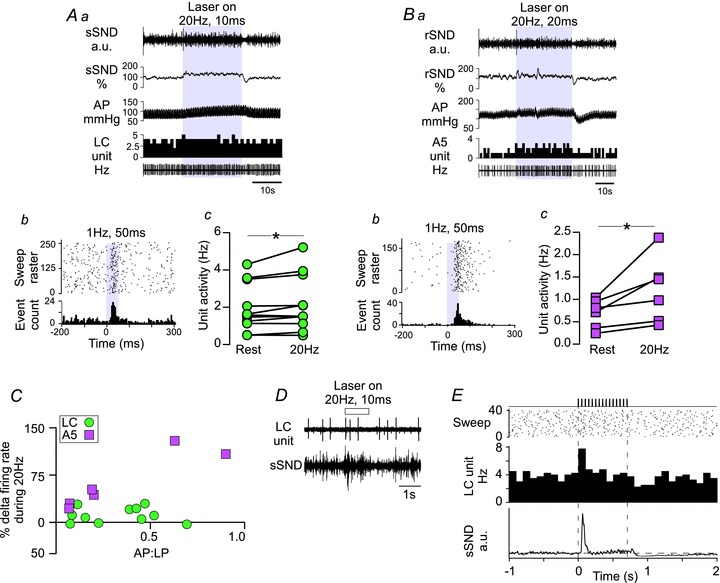
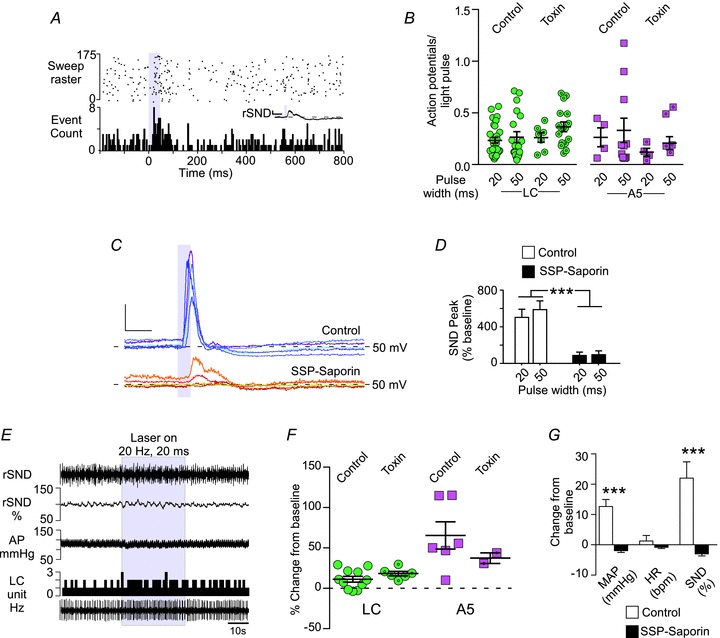
C1 neurons activate sympathetic tone and stimulate the hypothalamic–pituitary–adrenal axis in circumstances such as pain, hypoxia or hypotension. They also innervate pontine noradrenergic cell groups, including the locus coeruleus (LC) and A5. Activation of C1 neurons reportedly inhibits LC neurons; however, because these neurons are glutamatergic and have excitatory effects elsewhere, we re-examined the effect of C1 activation on pontine noradrenergic neurons (LC and A5) using a more selective method. Using a lentivirus that expresses channelrhodopsin2 (ChR2) under the control of the artificial promoter PRSx8, we restricted ChR2 expression to C1 neurons (67%), retrotrapezoid nucleus neurons (20%) and cholinergic neurons (13%). The LC contained ChR2-positive terminals that formed asymmetric synapses and were immunoreactive for vesicular glutamate transporter type 2. Low-frequency photostimulation of ChR2-expressing neurons activated LC (38 of 65; 58%) and A5 neurons (11 of 16; 69%) and sympathetic nerve discharge. Locus coeruleus and A5 inhibition was not seen unless preceded by excitation. Locus coeruleus activation was eliminated by intracerebroventricular kynurenic acid. Stimulation of ChR2-expressing neurons at 20 Hz produced modest increases in LC and A5 neuronal discharge. In additional rats, the retrotrapezoid nucleus region was destroyed with substance P–saporin prior to lentivirus injection into the rostral ventrolateral medulla, increasing the proportion of C1 ChR2-expressing neurons (83%). Photostimulation in these rats activated the same proportion of LC and A5 neurons as in control rats but produced no effect on sympathetic nerve discharge owing to the destruction of bulbospinal C1 neurons. In conclusion, low-frequency stimulation of C1 neurons activates pontine noradrenergic neurons and sympathetic nerve discharge, possibly via the release of glutamate from monosynaptic C1 inputs.


Figures

Figure 1
Figure 1. Response of a humanized enhanced channelrhodopsin2 (ChR2)-expressing rostral ventrolateral medulla (RVLM) neuron to different stimulus protocols
A, effect of three different stimulus protocols on the discharge of a representative ChR2-expressing neuron, presumed to be a C1 neuron based on its location and its baromodulated discharge pattern. Stimulation with 10 ms pulses delivered at 20 Hz entrains neuronal discharge at the stimulus frequency (Aa). Note that the first light pulse in the train produces two action potentials and a single one thereafter. Stimulation of the same neuron with 20 (Ab) or 50 ms (Ac) light pulses at 1 Hz reliably produces bursts of action potentials. B, raster plots of neuronal discharge during 20 consecutive stimuli for the examples presented in (A). In this case, 20 Hz stimulation with a 10 ms pulse (Ba) produce a single action potential for every light pulse, whereas low-frequency stimulation at 1 Hz reliably produces two and four action potentials per pulse using a 20 (Bb) and 50 ms (Bc) light pulse, respectively.
Figure 2
Figure 2. Channelrhodopsin2-expressing neurons in the RVLM innervate the locus coeruleus (LC) and A5 region and are excitatory
A, low-magnification view of a coronal section of the brainstem (approximately 11.6 mm caudal to bregma) in a rat injected with PRSx8-ChR2-mCherry lentivirus. Channelrhodopsin2-expressing neurons in the RVLM are predominantly catecholaminergic [tyrosine hydroxylase-immunoreactive (TH-ir); in green]. Channelrhodopsin2-mCherry (in red) is visualized with a cross-reacting DsRed antibody. Double-labelled neurons appear orange (examples indicated by arrows in the inset). Inset, higher power view of the RVLM region that contained transduced neurons. B, a juxtacellularly filled locus coeruleus (LC) neuron [neurobiotin (NB) in green; indicated by arrow] surrounded by many TH-ir neurons (in blue). Channelrhodopsin2-mCherry-ir axonal fibres (in red) course within the cell-body-rich core of the LC. C, a neurobiotin-filled A5 neuron (in green) containing TH-immunoreactivity (in blue). Channelrhodopsin2-mCherry-ir processes are in red, and a putative contact between an axonal varicosity and the recorded A5 neuron is indicated by an arrow. Catecholaminergic neurons in the A5 region are sparsely distributed compared with the LC. D, phenylethanolamine N-methyltransferase (PNMT)-ir processes (in red; Da) are vesicular glutamate transporter type 2 (VGLUT2)-ir (in green; Db) within the LC (TH in blue; Dc). The PNMT/VGLUT2-ir boutons appear in yellow; examples are indicated by arrows (Dd). E, mCherry-ir boutons (in red; Ea) are VGLUT2-ir (in green; Eb) in the LC (TH in blue; Ec), and mCherry/VGLUT2-ir boutons appear in yellow; examples are indicated by arrows (Ed). F and G show the ultrastructure of the synaptic contacts between the terminals of ChR2-mCherry-expressing neurons and an LC neuron. The mCherry-ir terminals (indicated with asterisks) contain intracellular and plasma-membrane-associated electron-dense immunoperoxidase reaction product. In both F and G, mCherry-ir terminals in the LC area make asymmetric synaptic contacts (black arrows) with unlabelled dendrites. An asymmetric synapse formed between an unlabelled terminal and an unlabelled dendrite is also shown (open arrow in F). Mitochondria are indicated with the letter m. H, rostrocaudal (left–right) distribution of mCherry-ir neurons after injection of PRSx8-ChR2-mCherry lentivirus into the RVLM of control rats (n= 19). The mCherry-ir, TH-ir and mCherry-ir, non-TH-ir neurons are presented separately, along with the total number of TH-ir neurons identified within the ipsilateral RVLM. The green arrowheads identify the level at which the lentiviral vector has been injected. I, rostrocaudal distribution of ChR2-mCherry-ir neurons in rats injected with substance P analogue (SSP)–saporin toxin to destroy RTN neurons (n= 7). The level at which the toxin was injected is indicated by two orange arrowheads. The PRSx8-ChR2-mCherry lentivirus was injected at the level indicated by the two green arrowheads. Note the reduction in the total number of TH-ir neurons rostral to a level –12.0 mm from bregma relative to H. Scale bars are as follows: A, 1 mm; inset, 250 μm; B, 125 μm; C, 40 μm; D, 30 μm; E, 30 μm; and F and G, 0.5 μm.
Figure 3
Figure 3. The effect of low-frequency photostimulation of the RVLM on the activity of LC neurons
A, waveform average of an extracellular recording of an LC neuron. Calibration bar: x-axis, 2 ms; and y-axis, 500 μV. B, the effect of a noxious pinch of the contralateral hindpaw on splanchnic sympathetic nerve discharge (sSND) and LC unit firing. Both sSND and LC activity show an initial burst of activity followed by a period of inactivity. C, simultaneous recording of sSND and LC activity during low-frequency photostimulation (1 Hz, 50 ms pulse) of the RVLM. D, peristimulus triggered histogram (PSTH) of the activity of an LC neuron during low-frequency stimulation with 20 (Da) or 50 ms light pulses (Db). Each action potential that occurred during the photostimulation trial is plotted as a single point in the raster plot (upper panel), and action potential counts are binned in 5 ms bins in the cumulative histogram (lower panel); 1 s sample period. Insets, waveform averages of sSND during the trial represented in the PSTH. Calibration bar: x-axis, 0.1 s; and y-axis, 300 mV. E, group averages of action potentials to light-pulse ratio for activated LC neurons. F, action potentials to light-pulse ratio in activated LC neurons tested with both 20 and 50 ms light pulses (*P < 0.05).
Figure 4
Figure 4. Excitatory amino acid blockade abolishes the excitation of LC neurons produced by photostimulation of the RVLM
Aa, waveform average of an extracellular recording of an LC neuron. Calibration bar: x-axis, 1 ms; and y-axis, 500 μV. Ab, raw recording of sSND discharge and the neuron in Aa during low-frequency photostimulation of the RVLM (1 Hz, 20 ms pulse). Ac, PSTH of the activity of the LC neuron in Aa during low-frequency stimulation. Inset, waveform average of sSND during the trial used to generate the PSTH. Calibration bar: x-axis, 0.1 s; and y-axis, 100 mV. Ba, as per Aa, except following intracerebroventricular (i.c.v.) administration of kynurenic acid (250 mm, 5 μl). Bb, as for Ab, following i.c.v. kynurenic acid. Bc, as for Ac, following i.c.v. kynurenic acid.
Figure 5
Figure 5. Effect of low-frequency photostimulation of the RVLM on the activity of A5 neurons
A, waveform average of an extracellular recording of an A5 neuron. Calibration bar: x-axis, 2 ms; and y-axis, 400 μV. B, bulbospinal A5 neurons were identified by antidromic activation. Note the constant latency of the action potential evoked by spinal cord stimulation (T2–T3) following the large stimulation artefact. The antidromic latency of this cell was 52 ms (conduction velocity, 0.7 m s−1). C, raw recording of renal sympathetic nerve discharge (rSND) and A5 activity during low-frequency stimulation of the RVLM (0.3 Hz, 50 ms pulse). Note that each stimulus produced multiple action potentials in this A5 neuron. D, PSTH of the activity of an A5 neuron during RVLM stimulation with 20 (Da) or 50 ms light pulses (Db; for details see legend to Fig. 3D). Insets, waveform averages of rSND during the trial represented in the PSTH. Calibration bar: x-axis, 0.1 s; and y-axis, 300 mV. E, group averages of action potentials to light-pulse ratio for activated A5 neurons. F, action potentials to light-pulse ratio for neurons tested with both 20 and 50 ms pulses (*P < 0.05).
Figure 6
Figure 6. Locus coeruleus and A5 neurons exhibit postactivation inhibition during low-frequency photostimulation
A, postactivation inhibition for all LC and A5 neurons that were significantly activated by photostimulation of the RVLM; for description of analysis, see Methods. B and C, postactivation inhibition for LC (B) and A5 neurons (C) tested with both 20 and 50 ms light pulses. D, x–y plot of the postactivation inhibition relative to the action potentials to light-pulse ratio (AP:LP ratio). The degree of inhibition was significantly correlated with the AP:LP ratio in both LC and A5 neurons (r2= 0.24 and 0.46, respectively, P < 0.01 for both).
Figure 7
Figure 7. High-frequency stimulation of the RVLM modestly increases the activity of LC and A5 neurons
A, the effects of high-frequency stimulation on LC neurons. Aa, original recording of a high-frequency stimulation trial (20 Hz, 10 ms pulse for 30 s). Stimulations produced reliable but modest increases in sSND (expressed as a percentage of baseline) and arterial pressure (AP), and a small increase in the activity of this particular LC neuron (in herz, 1 s bins). Ab, PSTH of the excitation produced by low-frequency stimulation (1 Hz, 50 ms) of the neuron presented in Aa. Ac, For all LC neurons tested (n= 11), high-frequency stimulation increased basal discharge rate (*P < 0.05). B, the effects of high-frequency stimulation on A5 neurons. Ba, original recording as for Aa, except that rSND was recorded. This A5 neuron showed an obvious increase in activity, with fast on–off kinetics. Bb, PSTH of the excitation produced by low-frequency stimulation (0.5 Hz, 50 ms) of the neuron presented in Ba. Bc, high-frequency stimulation increased basal discharge rate of A5 neurons (n= 6, *P < 0.05). C, xy plot of the effect of high-frequency stimulation (expressed as the percentage change from baseline activity) relative to the action potentials to light-pulse (AP:LP) ratio observed during low frequency photostimulation (50 ms pulses only). For A5 neurons, r2= 0.83, P= 0.01; and for LC neurons, r2 < 0.01, P= 0.96. D, original recording presenting the effect of a short, 1 s, train (20 Hz, 10 ms pulse) on sSND and LC unit activity. E, event-triggered averages of LC firing and sSND from 40 such trials (20 Hz, 10 ms pulse for 1 s every 10 s). Note that LC activity (100 ms bins) is initially increased after the onset of the stimulus, settles very close to prestimulus levels for the remainder of the stimulus and is reduced below baseline after the end of the stimulus. Note the similarity of the sSND response.
Figure 8
Figure 8. Destruction of the retrotrapezoid nucleus (RTN) with SSP–saporin does not reduce the activation of LC or A5 neurons produced by photostimulation of the RVLM
A, PSTH of a representative LC neuron, triggered by low-frequency stimulation (0.5 Hz, 50 ms) of the RVLM in a toxin-treated rat. Inset, waveform average of rSND during the trial. Calibration bar: x-axis, 0.2 s; y-axis, 100 mV. B, average action potentials to light-pulse ratio for LC and A5 neurons in control rats and toxin-treated rats. C, representative waveform averages of rSND during low-frequency photostimulation of the RVLM (50 ms pulse at <0.8 Hz) in control (n= 5, upper traces) and toxin-treated rats (n= 5, lower traces). Calibration bar: x-axis, 0.1 s; and y-axis, 100 mV. D, average evoked response produced by low-frequency stimulation in control and toxin-treated rats (n= 12 and 5, ***P < 0.001). E, representative example of an LC neuron (in herz, 1 s bins) activated by high-frequency (20 Hz, 20 ms pulse for 30 s) RVLM photostimulation in a toxin-treated rat. In toxin-treated rats, the effects of high-frequency photostimulation on arterial pressure (AP) and rSND were essentially eliminated. F, average increase in LC and A5 neuron activity produced by high-frequency RVLM photostimulation in control and toxin-treated rats. G, average cardiovascular effects produced by high-frequency RVLM photostimulation in control and toxin-treated rats (n= 6 and 6, ***P < 0.001).

References

    1. Abbott SB, Stornetta RL, Fortuna MG, Depuy SD, West GH, Harris TE, Guyenet PG. Photostimulation of retrotrapezoid nucleus phox2b-expressing neurons in vivo produces long-lasting activation of breathing in rats. J Neurosci. 2009a;29:5806–5819. - PMC - PubMed
    1. Abbott SB, Stornetta RL, Socolovsky CS, West GH, Guyenet PG. Photostimulation of channelrhodopsin-2 expressing ventrolateral medullary neurons increases sympathetic nerve activity and blood pressure in rats. J Physiol. 2009b;587:5613–5631. - PMC - PubMed
    1. Andrade R, Aghajanian GK. Single cell activity in the noradrenergic A-5 region: responses to drugs and peripheral manipulations of blood pressure. Brain Res. 1982;242:125–135. - PubMed
    1. Andrade R, Aghajanian GK. Locus coeruleus activity in vitro: intrinsic regulation by a calcium-dependent potassium conductance but not α2-adrenoceptors. J Neurosci. 1984;4:161–170. - PMC - PubMed
    1. Astier B, Vanbockstaele EJ, Aston-Jones G, Pieribone VA. Anatomical evidence for multiple pathways leading from the rostral ventrolateral medulla (nucleus paragigantocellularis) to the locus-coeruleus in rat. Neurosci Lett. 1990;118:141–146. - PubMed

Publication types

LinkOut - more resources