. 2012 May 8;109(19):7245-50.
doi: 10.1073/pnas.1116141109. Epub 2012 Apr 23.

Visual attention and the acquisition of information in human crowds

Affiliations

Visual attention and the acquisition of information in human crowds

Andrew C Gallup et al. Proc Natl Acad Sci U S A. .

Abstract

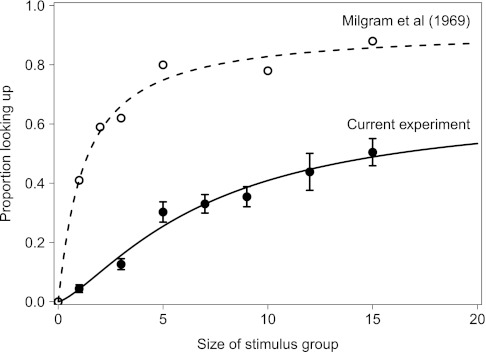
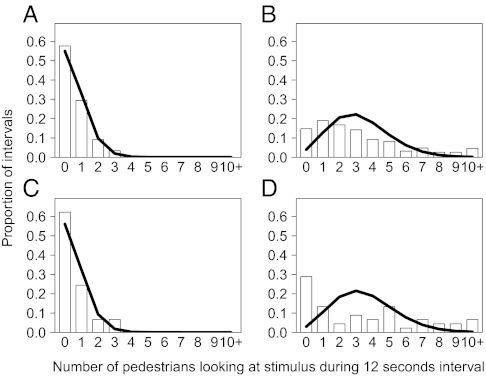
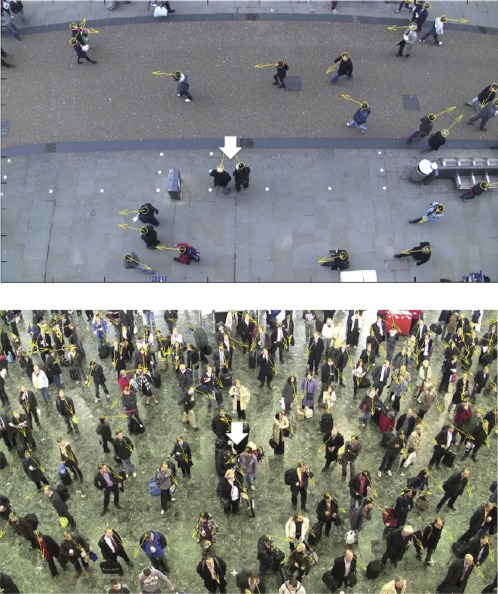
Pedestrian crowds can form the substrate of important socially contagious behaviors, including propagation of visual attention, violence, opinions, and emotional state. However, relating individual to collective behavior is often difficult, and quantitative studies have largely used laboratory experimentation. We present two studies in which we tracked the motion and head direction of 3,325 pedestrians in natural crowds to quantify the extent, influence, and context dependence of socially transmitted visual attention. In our first study, we instructed stimulus groups of confederates within a crowd to gaze up to a single point atop of a building. Analysis of passersby shows that visual attention spreads unevenly in space and that the probability of pedestrians adopting this behavior increases as a function of stimulus group size before saturating for larger groups. We develop a model that predicts that this gaze response will lead to the transfer of visual attention between crowd members, but it is not sufficiently strong to produce a tipping point or critical mass of gaze-following that has previously been predicted for crowd dynamics. A second experiment, in which passersby were presented with two stimulus confederates performing suspicious/irregular activity, supports the predictions of our model. This experiment reveals that visual interactions between pedestrians occur primarily within a 2-m range and that gaze-copying, although relatively weak, can facilitate response to relevant stimuli. Although the above aspects of gaze-following response are reproduced robustly between experimental setups, the overall tendency to respond to a stimulus is dependent on spatial features, social context, and sex of the passerby.


Conflict of interest statement

The authors declare no conflict of interest.

Figures

Fig. 1.
Fig. 1.
The relationship between the proportion of passersby that will copy the gaze of the stimulus group as a function of stimulus group size fitted to Eq. 1. The solid line represents the current experiments (m = 0.66, T = 7.0, and k = 1.38; mean ± SE shown). The dotted line is data from the work by Milgram et al. (10) (m = 0.92, T = 1.2, and k = 1.05; no error measures available).
Fig. 2.
Fig. 2.
Results from a simulation model of socially mediated gaze-following for a weak stimulus (A and B) and comparison with data in the second experiment (C and D). In the simulation, the times between individuals passing the stimulus are exponentially distributed, with mean time between passersby of (A) R = 2.4 s (low flow) and (B) R = 0.68 s (high flow). Passing individuals look at the stimulus with a probability s + (ms)N/(T + N), where N is the number of individuals already looking at the stimulus (the other parameters are explained in the text, and here, we use values s = 0.1, m = 1, and T = 4). If an individual looks at the stimulus, she continues looking for an exponentially distributed time with mean of 2 s. The histogram boxes show the distribution of the number of individuals seen to be looking at the stimulus in a 12-s time interval taken over 10,000 simulated s. Histograms of numbers of individuals observing the suspicious stimulus and comparative Poisson distributions (solid line) are given for (C) the shopping street (low flow) and (D) the commuter station (high flow), with the same mean as the simulated data.
Fig. 3.
Fig. 3.
The spatial distribution of pedestrians’ locations (Upper) and gaze-following behavior (Lower) within the 10 (horizontal) × 8-m (vertical) filming region. For illustrative purposes, this area was subdivided into 50-cm2 boxes, where blues indicate low density, reds indicate high density, and vectors represent the averaged course of pedestrian flow in each box. The white arrows represent the location of the stimulus group and direction of gaze. Data presented are the mean for all replicates for each of three group sizes: (A) one, (B) five, and (C) nine.
Fig. 4.
Fig. 4.
Still images from the video sequence of the second experiment showing the tracking of pedestrians and their estimated gaze direction in the shopping thoroughfare (Upper) and the commuter train station (Lower). The stimulus group members are shown in the center of each scene (as indicated by the white arrows).
Fig. 5.
Fig. 5.
The proportion of total frames in which the visual attention of pedestrians was directed to the stimulus group as a function of decreasing distance to these individuals in (A) the shopping street and (B) the train station (3.5-m radius). For every frame in which a pedestrian was within this radius, a score of one or zero was input, indicating whether their head was visually oriented to either of the stimulus group members. Note that each distance is not representative of an independent measure, because the frames contributing to lower distances are included within the larger distances (mean ± 95% confidence interval).

References

    1. Galef BG, Jr, Giraldeau LA. Social influences on foraging in vertebrates: Causal mechanisms and adaptive functions. Anim Behav. 2001;61:3–15. - PubMed
    1. Griffin AS. Social learning about predators: A review and prospectus. Learn Behav. 2004;32:131–140. - PubMed
    1. Lima SL. Back to the basics of anti-predatory vigilance: The group-size effect. Anim Behav. 1995;49:11–20.
    1. Cavagna A, et al. Scale-free correlations in starling flocks. Proc Natl Acad Sci USA. 2010;107:11865–11870. - PMC - PubMed
    1. Couzin ID. Collective cognition in animal groups. Trends Cogn Sci. 2009;13:36–43. - PubMed

Publication types