. 2012 May 8;109(19):7379-84.
doi: 10.1073/pnas.1120467109. Epub 2012 Apr 23.

Cenozoic imprints on the phylogenetic structure of palm species assemblages worldwide

Affiliations

Cenozoic imprints on the phylogenetic structure of palm species assemblages worldwide

W Daniel Kissling et al. Proc Natl Acad Sci U S A. .

Abstract

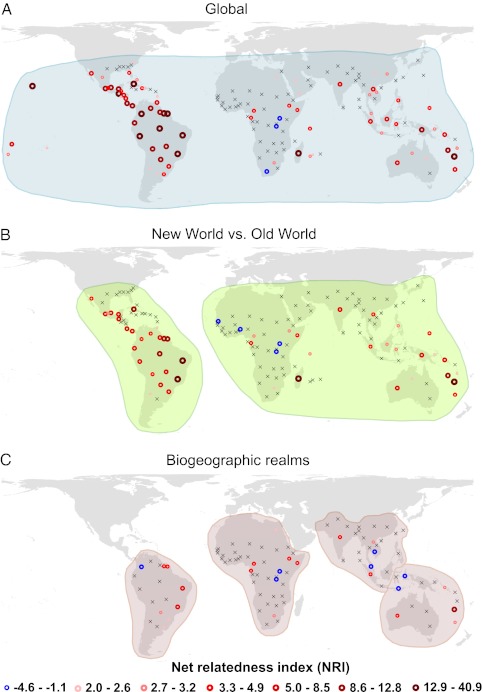
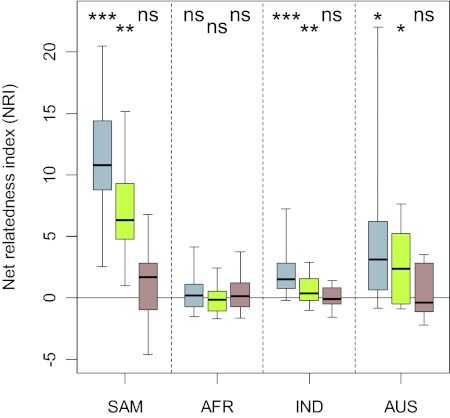
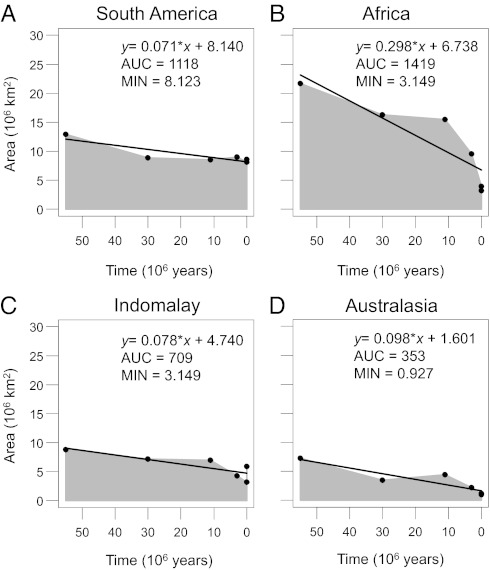
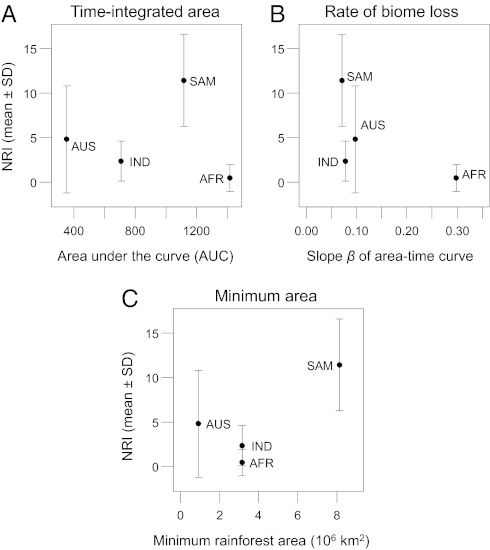
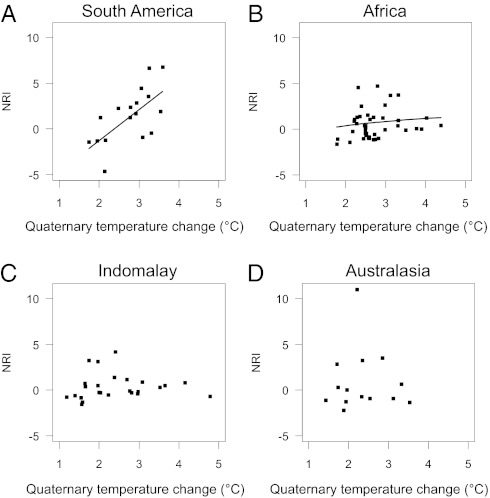
Despite long-standing interest in the origin and maintenance of species diversity, little is known about historical drivers of species assemblage structure at large spatiotemporal scales. Here, we use global species distribution data, a dated genus-level phylogeny, and paleo-reconstructions of biomes and climate to examine Cenozoic imprints on the phylogenetic structure of regional species assemblages of palms (Arecaceae), a species-rich plant family characteristic of tropical ecosystems. We find a strong imprint on phylogenetic clustering due to geographic isolation and in situ diversification, especially in the Neotropics and on islands with spectacular palm radiations (e.g., Madagascar, Hawaii, and Cuba). Phylogenetic overdispersion on mainlands and islands corresponds to biotic interchange areas. Differences in the degree of phylogenetic clustering among biogeographic realms are related to differential losses of tropical rainforests during the Cenozoic, but not to the cumulative area of tropical rainforest over geological time. A largely random phylogenetic assemblage structure in Africa coincides with severe losses of rainforest area, especially after the Miocene. More recent events also appear to be influential: phylogenetic clustering increases with increasing intensity of Quaternary glacial-interglacial climatic oscillations in South America and, to a lesser extent, Africa, indicating that specific clades perform better in climatically unstable regions. Our results suggest that continental isolation (in combination with limited long-distance dispersal) and changing climate and habitat loss throughout the Cenozoic have had strong impacts on the phylogenetic structure of regional species assemblages in the tropics.


Conflict of interest statement

The authors declare no conflict of interest.

Figures

Fig. 1.
Fig. 1.
The phylogenetic structure of palm assemblages given species pools restricted to (A) global (shaded blue), (B) hemispheric (New World vs. Old World) (shaded green), and (C) biogeographic realm (shaded brown) extent. The NRI is plotted for the mass centroid of each sample unit (“botanical country”). Blue circles indicate significantly (P < 0.05) negative NRI values (phylogenetic overdispersion). Red circles represent significantly positive NRI values (phylogenetic clustering) with darker red and larger circles indicating increases in NRI (quantile classification based on values in A). An “x” indicates nonsignificant NRI values. Maps are in Behrmann projection.
Fig. 2.
Fig. 2.
Effect of sampling pool extent on phylogenetic structure of palm assemblages in South America (SAM), Africa (AFR), Indomalaya (IND), and Australasia (AUS). Box plots summarize values of the NRI within each biogeographic realm for a given sampling pool. Colors of sampling pool extent as in Fig. 1. Statistical significance of whether mean NRI differs from zero is given above each box plot (ns, not significant; *P < 0.05; **P < 0.01; ***P < 0.001; see SI Appendix, Table S1 for details of the tests). Boxes represent the interquartile range (IQR), horizontal lines within the boxes represent medians, and whiskers extend to 1.5 times the IQR.
Fig. 3.
Fig. 3.
Area-time plots representing the area of tropical rainforest over geological time: (A) South America, (B) Africa, (C) Indomalaya, and (D) Australasia. The area under the curve (AUC) is illustrated in gray and measures the time-integrated area of this biome from the Eocene to the present (106 km2/55 Mya). Black lines indicate a simple linear regression. The steepness (i.e., negative slope β) of these regression lines (given in the regression formulas) approximates the rate of biome loss over geological time. The minimum area (MIN, in 106 km2) during the Cenozoic is also provided.
Fig. 4.
Fig. 4.
The relationship between net relatedness (NRI) of palm assemblages and habitat availability over geological time (AFR, Africa; AUS, Australasia; IND, Indomalay; SAM, South America). Habitat availability was specified as (A) area under the curve (AUC) of area-time plots, (B) rate of biome loss (measured as slope β of a simple linear regression of area vs. time), and (C) minimum area of tropical rainforest during the Cenozoic. Compare with Fig. 3.
Fig. 5.
Fig. 5.
The effect of Quaternary climatic oscillations on the net relatedness index (NRI, calculated with a realm sampling pool): (A) South America, (B) Africa, (C) Indomalaya, and (D) Australasia. Quaternary climatic oscillations were quantified as the change in mean annual temperature (anomaly) between the Last Glacial Maximum (∼0.021 Mya) and the present (in °C; SI Appendix, Fig. S2). See SI Appendix, Tables S4 and S5, for statistical results.

References

    1. Hill JL, Hill RA. Why are tropical rain forests so species rich? Classifying, reviewing and evaluating theories. Prog Phys Geogr. 2001;25:326–354.
    1. Mittelbach GG, et al. Evolution and the latitudinal diversity gradient: Speciation, extinction and biogeography. Ecol Lett. 2007;10:315–331. - PubMed
    1. Hawkins BA, et al. Energy, water, and broad-scale geographic patterns of species richness. Ecology. 2003;84:3105–3117.
    1. Allen AP, Brown JH, Gillooly JF. Global biodiversity, biochemical kinetics, and the energetic-equivalence rule. Science. 2002;297:1545–1548. - PubMed
    1. Currie DJ, et al. Predictions and tests of climate-based hypotheses of broad-scale variation in taxonomic richness. Ecol Lett. 2004;7:1121–1134.

Publication types

LinkOut - more resources