

Geographic and racial variation in premature mortality in the U.S.: analyzing the disparities
- PMID: 22529892
- PMCID: PMC3328498
- DOI: 10.1371/journal.pone.0032930
Geographic and racial variation in premature mortality in the U.S.: analyzing the disparities
Abstract
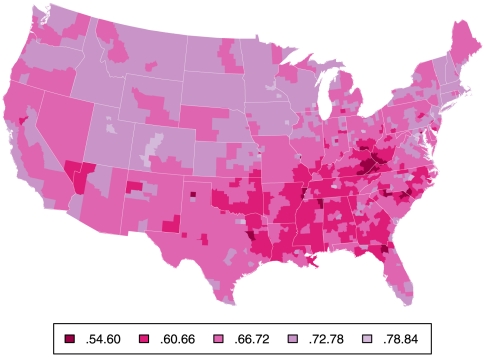
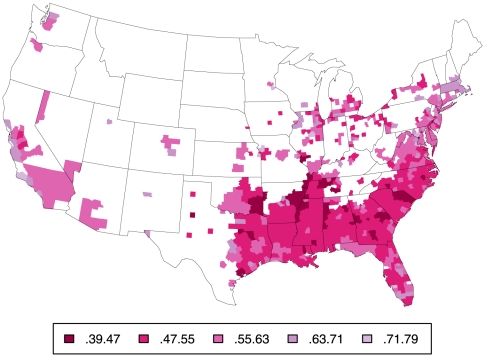
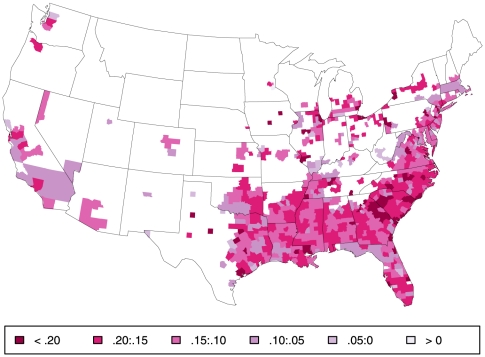
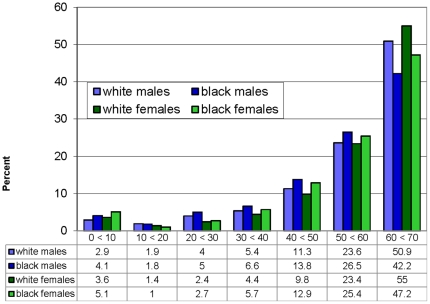
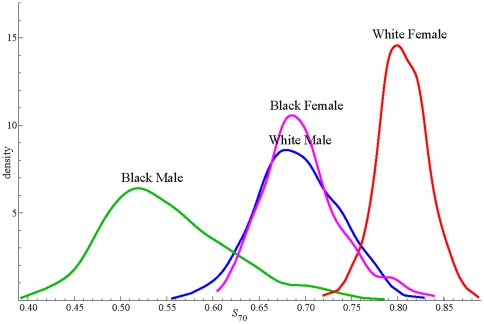
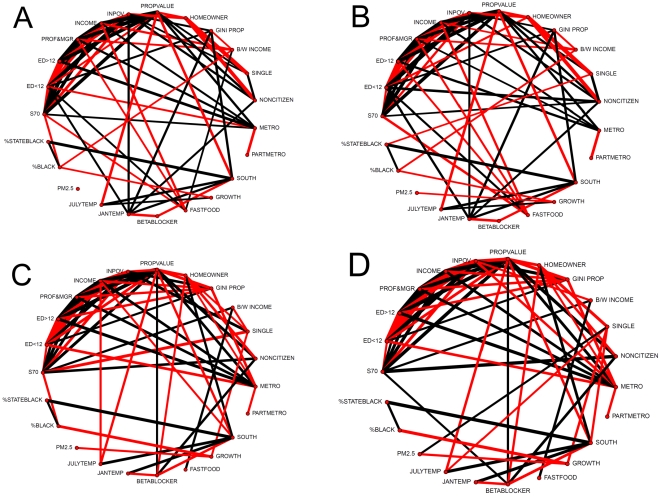
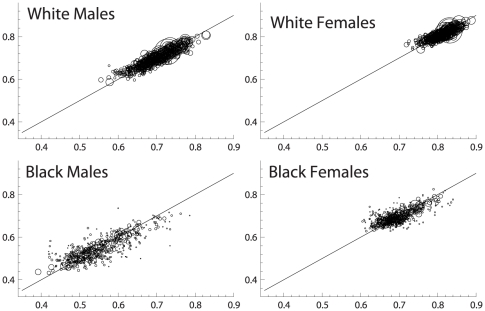
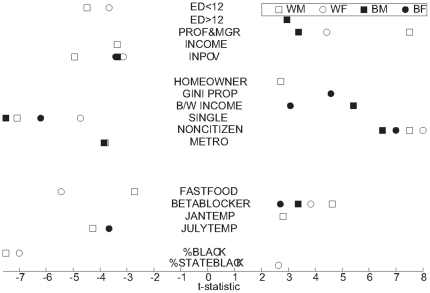
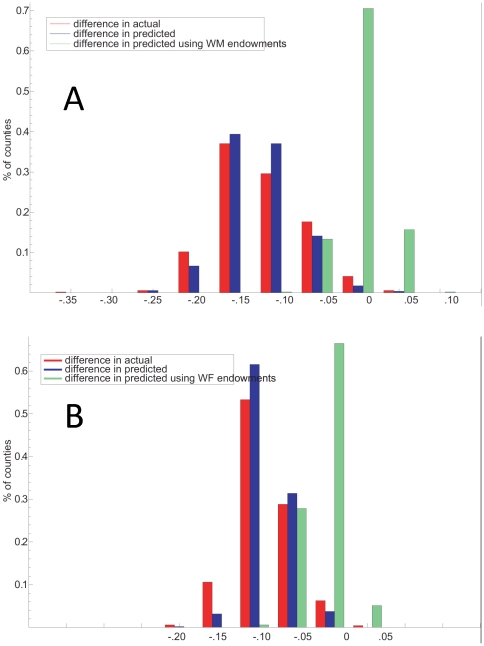
Life expectancy at birth, estimated from United States period life tables, has been shown to vary systematically and widely by region and race. We use the same tables to estimate the probability of survival from birth to age 70 (S(70)), a measure of mortality more sensitive to disparities and more reliably calculated for small populations, to describe the variation and identify its sources in greater detail to assess the patterns of this variation. Examination of the unadjusted probability of S(70) for each US county with a sufficient population of whites and blacks reveals large geographic differences for each race-sex group. For example, white males born in the ten percent healthiest counties have a 77 percent probability of survival to age 70, but only a 61 percent chance if born in the ten percent least healthy counties. Similar geographical disparities face white women and blacks of each sex. Moreover, within each county, large differences in S(70) prevail between blacks and whites, on average 17 percentage points for men and 12 percentage points for women. In linear regressions for each race-sex group, nearly all of the geographic variation is accounted for by a common set of 22 socio-economic and environmental variables, selected for previously suspected impact on mortality; R(2) ranges from 0.86 for white males to 0.72 for black females. Analysis of black-white survival chances within each county reveals that the same variables account for most of the race gap in S(70) as well. When actual white male values for each explanatory variable are substituted for black in the black male prediction equation to assess the role explanatory variables play in the black-white survival difference, residual black-white differences at the county level shrink markedly to a mean of -2.4% (+/-2.4); for women the mean difference is -3.7% (+/-2.3).
Conflict of interest statement
Figures
References
-
- Centers for Disease Control and Prevention. CDC Health Disparities and Inequalities Report — United States , 2011. 2011;60(Suppl):1–116.
-
- Armstrong D, Barnett E, Casper M, Wing S. Community occupational structure, medical and economic resources, and coronary mortality among U.S. blacks and whites, 1980–1988. Annals of Epidemiology. 1998;8:184–91. - PubMed
-
- Backlund E, Rowe G, Lynch J, Wolfson MC, Kaplan GA, et al. Income inequality and mortality: a multilevel prospective study of 521,248 individuals in 50 US states. International Journal of Epidemiology. 2007;36:590–6. - PubMed
MeSH terms
LinkOut - more resources
Full Text Sources
Miscellaneous
