. 2012;7(4):e35507.
doi: 10.1371/journal.pone.0035507. Epub 2012 Apr 18.

Brewhouse-resident microbiota are responsible for multi-stage fermentation of American coolship ale

Affiliations

Brewhouse-resident microbiota are responsible for multi-stage fermentation of American coolship ale

Nicholas A Bokulich et al. PLoS One. 2012.

Abstract

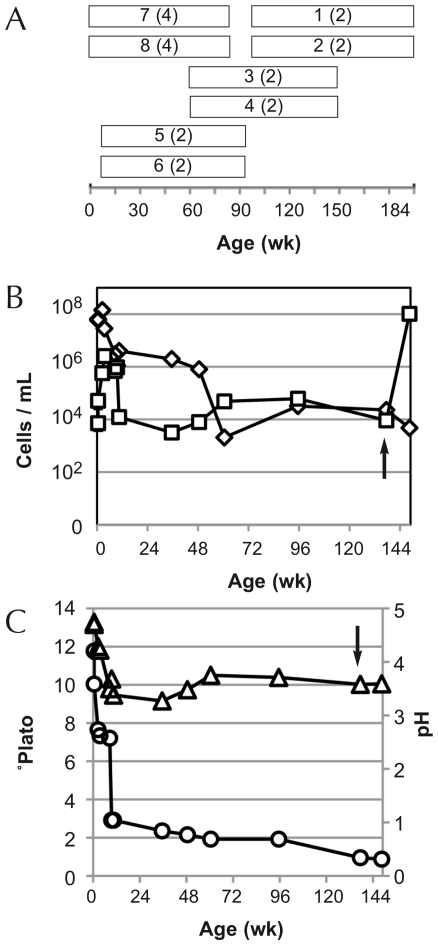
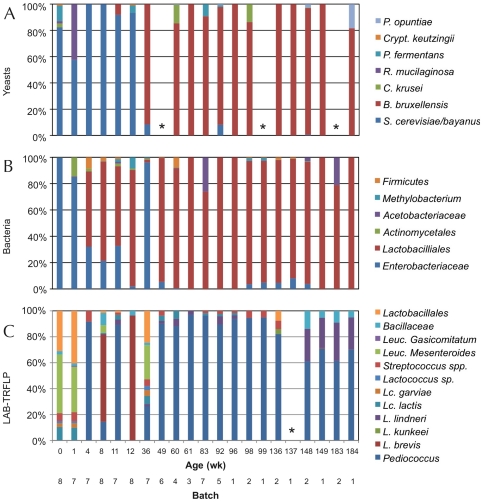
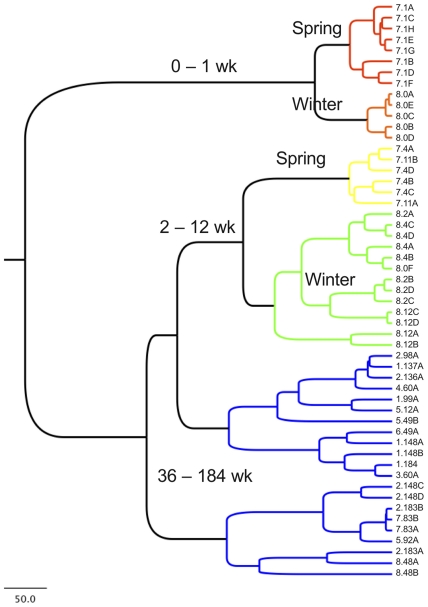
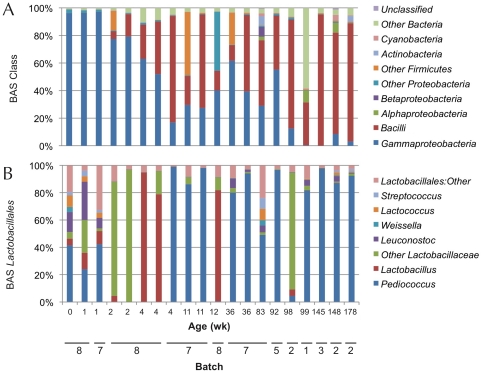
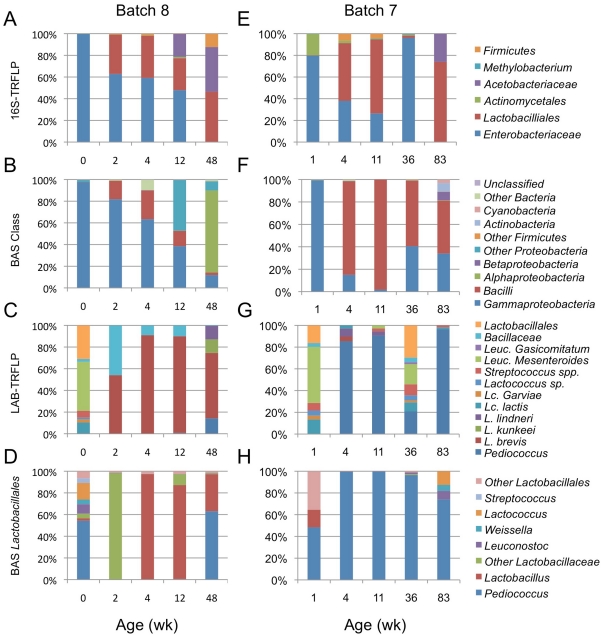
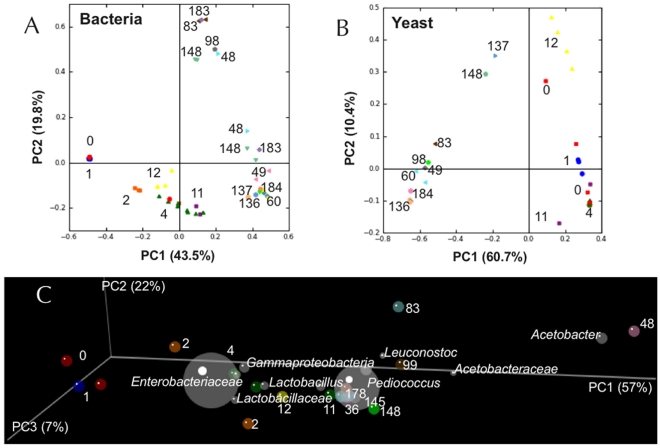
American coolship ale (ACA) is a type of spontaneously fermented beer that employs production methods similar to traditional Belgian lambic. In spite of its growing popularity in the American craft-brewing sector, the fermentation microbiology of ACA has not been previously described, and thus the interface between production methodology and microbial community structure is unexplored. Using terminal restriction fragment length polymorphism (TRFLP), barcoded amplicon sequencing (BAS), quantitative PCR (qPCR) and culture-dependent analysis, ACA fermentations were shown to follow a consistent fermentation progression, initially dominated by Enterobacteriaceae and a range of oxidative yeasts in the first month, then ceding to Saccharomyces spp. and Lactobacillales for the following year. After one year of fermentation, Brettanomyces bruxellensis was the dominant yeast population (occasionally accompanied by minor populations of Candida spp., Pichia spp., and other yeasts) and Lactobacillales remained dominant, though various aerobic bacteria became more prevalent. This work demonstrates that ACA exhibits a conserved core microbial succession in absence of inoculation, supporting the role of a resident brewhouse microbiota. These findings establish this core microbial profile of spontaneous beer fermentations as a target for production control points and quality standards for these beers.


Conflict of interest statement

Competing Interests: NB has received multiple scholarships donated by commercial funding sources (Briess Malt, Cargill Malt, Wine spectator; see below). All scholarships were reviewed and awarded by third-party sources (American Society of Brewing Chemists, UC Davis Department of Viticulture and Enology) and none of these companies had any contact with the authors. This does not alter the authors' adherence to all the PLoS ONE policies on sharing data and materials.

Figures

Figure 1
Figure 1. ACA fermentation profile and sampling regime.
Panel A: Sampling regime employed representing 3 years of ACA fermentation. White bars represent the span of sampling times for each batch. Labels indicate batch number (number of barrel replicates in parenthesis). Panels B/C: Real-time PCR of total bacteria and total yeast populations (Panel B) and pH and °Plato (Panel C) across ACA fermentation. All values are averages of multiple batches tested in duplicate (where possible; Figure S1). Error bars indicate ±1 standard deviation. ◊, Total bacteria; □, total yeasts; ▵, pH; ○, °Plato. Arrow indicates time at which fruit was added and beer was refermented in bottle.
Figure 2
Figure 2. TRFLP analysis of ACA fermentation succession across complete timescale.
Normalized relative OTU peak areas for multiple ACA fermentations observed over a 3-year period by ITS-TRFLP (yeasts, Panel A), 16S-TRFLP (bacteria, Panel B), and LAB-TRFLP (lactic acid bacteria, Panel C). All samples were tested in duplicate, when possible, and each bar represents averaged duplicates for a single time point, single barrel. y-axes indicate relative OTU abundance. *Sample was not amplifiable with these specific primers.
Figure 3
Figure 3. UPGMA hierarchical clustering demonstrates age-based grouping of samples.
Hierarchical relationship among samples based on Euclidean distance of 16S-TRFLP OTU abundance profiles derived from the MspI restriction digest. Node labels (and associated colors) indicate age- and batch-based groups. Tip labels indicate batch number.wk.
Figure 4
Figure 4. Bacterial taxa abundance measured using BAS 5′ sequences.
Panel A: Class-level taxon relative abundance per sample as a percentage of total sequences. Panel B: Genus-level relative abundance of Lactobacillales. All bars represent a single sample from a single batch, and most time points are represented by at least two independent samples (where available), as presented. y-axes indicate relative OTU abundance.
Figure 5
Figure 5. Parallel ACA batch comparison.
Comparison of universal bacterial community structure (A,B,E,F) and Lactobacillales (C,D,G,H) in Spring batch 7 (right) and Winter batch 8 (left). Panel A/E: Relative abundance of 16S-TRFLP bacterial OTUs. Panel B/F: Class-level abundance per sample as percentage of total BAS sequences. Panel C/G: Relative abundance of LAB-TRFLP OTUs. Panel D/H: Genus-level relative abundance of Lactobacillales BAS sequences. All TRFLP samples are averages of duplicate samples. y-axes indicate relative OTU abundance.
Figure 6
Figure 6. Principal coordinates analysis of ACA microbial succession.
PCoA of Bray-Curtis dissimilarity scores derived from 16S-TRFLP of universal bacterial communities (Panel A) and ITS-TRFLP of yeasts (Panel B). Samples are colored by age (wk), as indicated by adjacent number. Sample distance is a function of shared OTU similarity. Panel C: 3-dimensional PCoA of weighted UniFrac distance of BAS of ACA samples. Samples are colored by age (wk), as indicated by adjacent number, their distance within the 3-dimensional space being a function of the phylogenetic similarity and abundance of their constituent taxa. Grey bubbles represent correlation of loadings (as taxonomic groups) along the same coordinates; their placement explains how much variance along each PC is explained by these taxa, with size as a function of relative abundance.

References

    1. Vanoevelen D, Spaepen M, Timmermans P, Verachtert H. Microbial aspects of spontaneous fermentation in production of lambic and gueuze. J Inst Brew. 1977;83:356–360.
    1. Verachtert H, Shanta Kumara HMC, Dawoud E. Yeasts in Mixed Cultures. In: Verachtert H, De Mot R, editors. Yeast Biotechnology and Biocatalysis. New York: Marcel Dekker; 1990.
    1. Vanoevelen D, Delescaille F, Verachtert H. Synthesis of aroma compounds during spontantous fermentation of lambic and gueuze. J Inst Brew. 1976;82:322–326.
    1. Spaepen M, Vanoevelen D, Verachtert H. Fatty acids and esters produced during spontaneous fermentation of lambic and gueuze. J Inst Brew. 1978;84:278–282.
    1. Bokulich NA, Hwang CF, Liu S, Boundy-Mills K, Mills DA. Profiling the yeast communities of wine using terminal restriction fragment length polymorphism. Am J Enol Vitic. 2012;63 doi: 10.5344/ajev.2011.11077. - DOI

Publication types