. 2012 May 30;31(11):2615-28.
doi: 10.1038/emboj.2012.93. Epub 2012 Apr 24.

Caspase-2 is an initiator caspase responsible for pore-forming toxin-mediated apoptosis

Affiliations

Caspase-2 is an initiator caspase responsible for pore-forming toxin-mediated apoptosis

Gergely Imre et al. EMBO J. .

Abstract

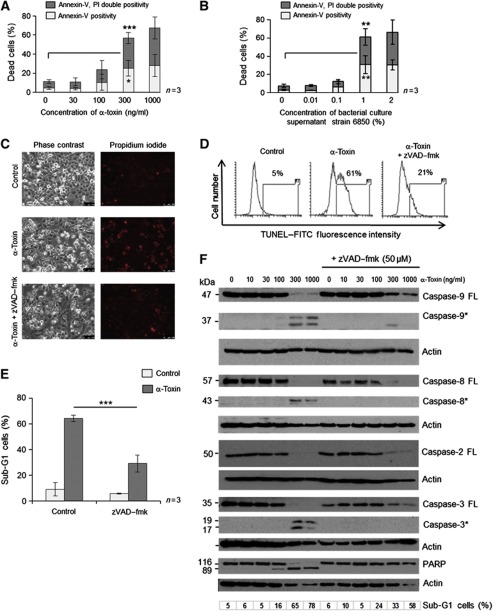
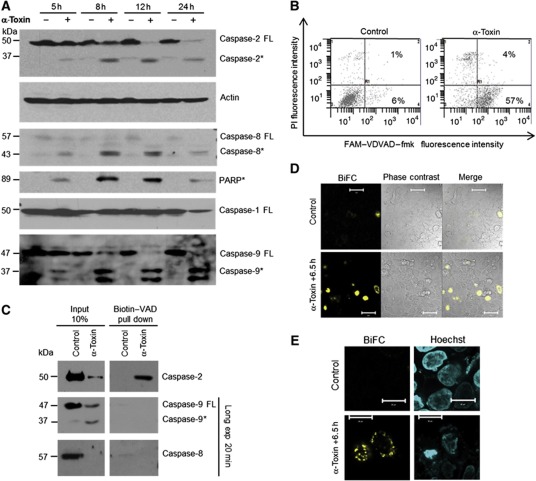
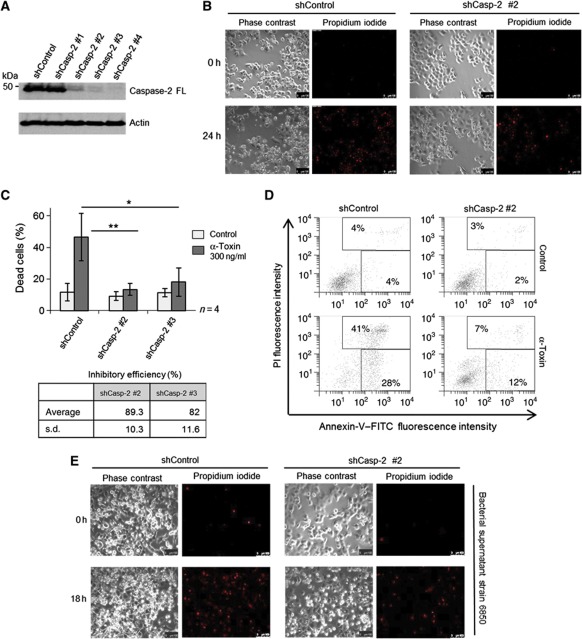
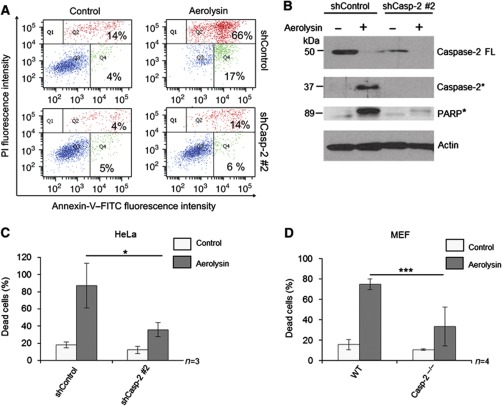
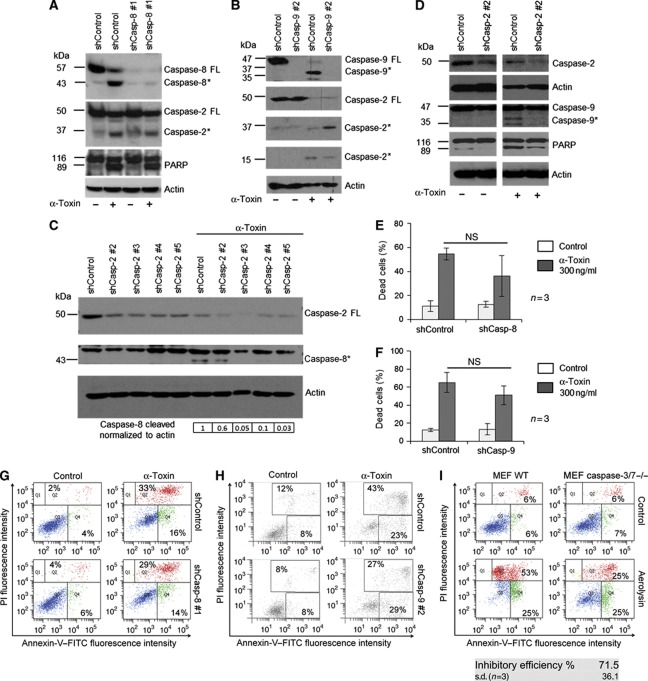
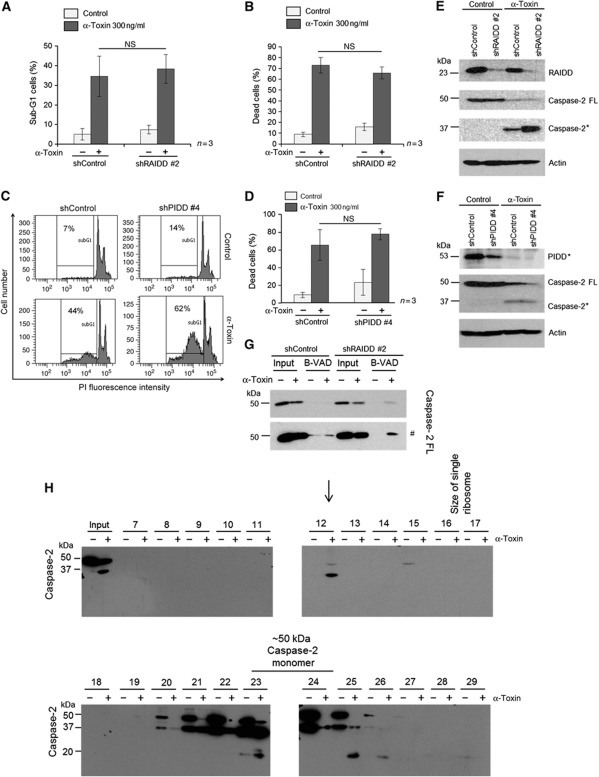
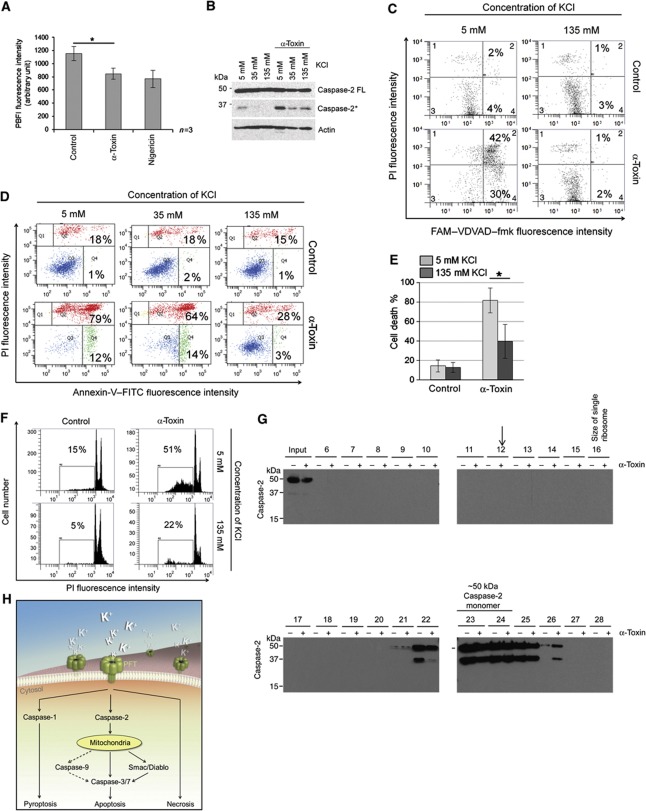
Bacterial pathogens modulate host cell apoptosis to establish a successful infection. Pore-forming toxins (PFTs) secreted by pathogenic bacteria are major virulence factors and have been shown to induce various forms of cell death in infected cells. Here we demonstrate that the highly conserved caspase-2 is required for PFT-mediated apoptosis. Despite being the second mammalian caspase to be identified, the role of caspase-2 during apoptosis remains enigmatic. We show that caspase-2 functions as an initiator caspase during Staphylococcus aureus α-toxin- and Aeromonas aerolysin-mediated apoptosis in epithelial cells. Downregulation of caspase-2 leads to a strong inhibition of PFT-mediated apoptosis. Activation of caspase-2 is PIDDosome-independent, and endogenous caspase-2 is recruited to a high-molecular-weight complex in α-toxin-treated cells. Interestingly, prevention of PFT-induced potassium efflux inhibits the formation of caspase-2 complex, leading to its inactivation, thus resisting apoptosis. These results revealed a thus far unknown, obligatory role for caspase-2 as an initiator caspase during PFT-mediated apoptosis.


Conflict of interest statement

The authors declare that they have no conflict of interest.

Figures

Figure 1
Figure 1
S. aureus α-toxin induces caspase-dependent apoptotic cell death in human epithelial cells. HeLa cells were treated with various concentrations of (A) purified α-toxin or (B) bacterial culture supernatants (from strain 6850) for 24 h. The cells were then subjected to flow cytometric analysis after staining for annexin-V-FITC and propidium iodide, as mentioned in the methods. Dead cells refer to percentage of cells encompassing both annexin-V single-positive (early apoptotic) as well as annexin-V, PI double-positive (late apoptotic) cells. Shown are the data from three independent experiments. (C) Microscopic analysis of HeLa cells treated with 300 ng/ml of α-toxin in the presence or absence of zVAD–fmk (50 μM). Shown are representative images of a time-lapse imaging analysis at 24 h after α-toxin treatment. (left panel: phase contrast, right panel: propidium iodide staining in red). (D) HeLa cells were treated with α-toxin (300 ng/ml) for 24 h in the presence or absence of zVAD–fmk (50 μM) and the extent of DNA fragmentation was monitored by TUNEL analysis with flow cytometry, as mentioned in the methods section. The percentage of TUNEL-positive cells is gated. (E) HeLa cells were treated with α-toxin either alone or with 50 μM of zVAD–fmk, and the cells were subjected to flow cytometric analysis after PI staining to detect the sub-G1 population, as mentioned in the methods section. Shown are data from three independent experiments±s.d. (F) HeLa cells were treated with various concentrations of α-toxin and the processing of various proteins was monitored by western blots. The cells were pretreated with 50 μM of zVAD–fmk to prevent activation of caspases. (FL—full-length protein, *—processed form). The percentage of dead cells (sub-G1 population) in each case is denoted (*=P<0.05, **=P<0.01, ***=P<0.005). Figure source data can be found with the Supplementary data.
Figure 2
Figure 2
Caspase-2 is the initiator caspase during α-toxin-mediated apoptosis. (A) HeLa cells were treated with α-toxin (300 ng/ml) for various time points and the processing of caspases-2, -9, -8, -1 and PARP were monitored by immunoblots. Caspase-2 was detected by monoclonal antibody (clone 11b4; FL—full-length protein, *—processed form). (B) Flow cytometric analysis of caspase-2 activity. HeLa cells were incubated with or without α-toxin (300 ng/ml) for 24 h. Percentage of cells displaying caspase-2 activity is denoted. The cells were co-stained with PI to monitor membrane damage. (C) HeLa cells pretreated with biotin-VAD and treated with α-toxin as mentioned earlier. The activated caspases are precipitated as mentioned in the methods section. (D, E) BiFC of caspase-2 CARD. Hela cells transfected with venus–CARD constructs were treated with toxin, and BiFC (yellow) was measured under a confocal microscope. The nuclei are stained with Hoechst (blue) and the overlay is presented. Figure source data can be found with the Supplementary data.
Figure 3
Figure 3
Caspase-2 is required for α-toxin-mediated apoptosis. (A) HeLa cells stably expressing various shRNAs directed against caspase-2 or control shRNA were subjected to immunoblot analysis to check for the efficiency of knockdown. Actin was used as a loading control. (B) Microscopic analysis of shControl and shCaspase-2 cells to monitor membrane permeabilization after α-toxin (300 ng/ml) treatment. Shown are representative images at 0 and 24 h after toxin treatment from a time-lapse imaging experiment. Shown in left are phase-contrast images, and in right are the identical regions with PI staining (red). (C) Flow cytometric analysis of HeLa cells (stably expressing either shControl or two shRNAs directed against caspase-2) treated with α-toxin (300 ng/ml) for 24 h. Percentage of dead cells represents both annexin-V single-positive and annexin-V, PI double-positive cells. The inhibitory efficiency is denoted in the table. Shown are data from four independent experiments. Error bars represent ±s.d. of the mean. (D) Representative scatter plots from flow cytometric analysis of control and caspase-2-depleted cells displaying annexin-V, PI staining from C. (E) Microscopic analysis (left panel: phase contrast, right panel: PI staining—red) of control and caspase-2-depleted HeLa cells treated with bacterial supernatant. shControl and shCaspase-2 #2 cells were incubated with or without bacterial supernatant from stain 6850 (1%, v/v) (*=P<0.05, **=P<0.01, ***=P<0.005). Figure source data can be found with the Supplementary data.
Figure 4
Figure 4
Caspase-2 is required for aerolysin-mediated apoptosis. (A) Representative dot plots of flow cytometric analysis of control and caspase-2-knockdown cells upon aerolysin toxin treatment (5 ng/ml for 48 h). Cells were subjected to annexin-V and PI staining and the percentage of cells displaying annexin-V single positivity (Q4) and annexin-V, PI double positivity (Q2) are denoted. (B) Western blot analysis of HeLa cells treated with aerolysin for 24 h. The processing of caspase-2 and PARP was monitored (FL—full-length protein, *—processed form). (C) Flow cytometric analysis of caspase-2-knockdown HeLa cells 48 h after aerolysin (5 ng/ml) treatment and (D) Caspase-2-/- MEFs 24 h after aerolysin (5 ng/ml) treatment. Percentage of dead cells represents the percentage of cells displaying both annexin-V single positivity and annexin-V, PI double positivity out of the total number of cells (*=P<0.05, **=P<0.01, ***=P<0.005). Figure source data can be found with the Supplementary data.
Figure 5
Figure 5
Caspases-8 and -9 are not required for α-toxin-mediated apoptosis. (A) Western blot detection of caspase-2 processing in shControl and shCaspase-8 cells, and in (B) shControl and shCaspase-9 cells after α-toxin treatment (300 ng/ml, 24 h). (C) Western blot analysis of caspase-8 and (D) caspase-9 cleavage in shControl and shCaspase-2 cells. The cells were treated with α-toxin (300 ng/ml, 24 h). Cleavage of PARP was monitored and actin was used as a loading control. (E, F) represents the percentage of cells exhibiting both annexin-V single positivity and annexin-V, PI double positivity compared to the total number of cells. (G and H) Representative scatter plots of cell death analysis in (E) caspase-8 and (F) caspase-9-knockdown cells. ShControl and shCasp-8 #1 or shCasp-9 #2 cells were incubated with or without α-toxin (300 ng/ml) for 24 h, respectively, and subjected to annexin-V, PI staining and flow cytometry analysis (NS—not significant). (I) Wild-type and caspase-3/7 double-deficient MEFs were challenged with aerolysin, and cell death was measured by annexin-V, PI analysis. Shown are data from one representative experiment. The inhibition efficiency is ∼71.5% (n=3). Figure source data can be found with the Supplementary data.
Figure 6
Figure 6
α-Toxin-mediated caspase-2 activation is independent of PIDDosome. HeLa cells stably expressing scrambled control or RAIDD shRNAs are treated with or without α-toxin (300 ng/ml) for 8 h and subjected to Sub-G1 or treated for 24 h and subjected to annexin-V, PI staining. Percentage of cells representing sub-G1 population is presented in A, and the percentage of cells displaying both annexin-V single positivity and annexin-V, PI double positivity is presented in B. Shown are data from three independent experiments. Error bars represent±s.d. of the mean. (C) Representative experiment from sub-G1 analysis of control and PIDD-depleted cells after α-toxin treatment (8 h, 300 ng/ml). (D) Control and PIDD-depleted HeLa cells were treated with α-toxin (24 h, 300 ng/ml) and the percentage of cells displaying annexin-V single positivity and annexin-V, PI double positivity is depicted. Shown are data from three independent experiments (NS—not significant). HeLa cells stably expressing control or RAIDD (E) or PIDD (F) shRNAs were subjected to α-toxin treatment (24 h, 300 ng/ml), and processing of caspase-2 was monitored by immunoblots. (FL—full–length protein, *—processed form). (G) Control and RAIDD-depleted HeLa cells were subjected to biotin-VAD analysis, as mentioned in the methods section. The presence of caspase-2 was monitored in the biotin-VAD (B-VAD) precipitates by immunoblot analysis (# denoted the higher exposure of blots presented above). (H) Western blot analysis of various fractions obtained after size exclusion chromatography. Cell lysates from HeLa cells treated with or without α-toxin (8 h, 300 ng/ml) are subjected to gel filtration analysis, as mentioned in the methods section. The proteins in the individual fractions were precipitated with TCA, and the presence of caspase-2 was monitored by immunoblot analysis, as mentioned in the methods section. Processed form of caspase-2 consistently eluted in fraction #12 in α-toxin-treated cells. Single ribosomes (∼2.3 MDa) eluted around fractions 16–17. The occurrence of processed protease in non-treated cell lysates is most likely caused by the sample handling during preparation for the gel filtration experiment, as basically no activated caspase-2 is visible in the lane of a sample frozen directly after cell lysis (input lane) or in western blot shown in Figure 2A. Figure source data can be found with the Supplementary data.
Figure 7
Figure 7
Potassium efflux is required for α-toxin-mediated caspase-2 activation and apoptosis. (A) HeLa cells were treated with solvent, α-toxin (300 ng/ml) or nigericin for 5 h, and intracellular potassium levels were analysed by measuring PBFI fluorescence as mentioned in the methods section. Shown are data from three independent experiments. (B) HeLa cells were cultured in media with various potassium ion (KCl) concentrations before α-toxin treatment (24 h, 300 ng/ml) and subjected to various analyses. The cleavage of caspase-2 is monitored by immunoblot. (C) Activation of caspase-2 was measured by FAM-VDVAD fluorescence. (D, E) Annexin-V, PI detection or (F) appearance of sub-G1 population as measured by flow cytometric analysis, respectively. Panels D and F are representative experiments. (G) HeLa cells were cultured in high potassium media (135 mM KCl) and then treated with α-toxin (8 h, 300 ng/ml). Cell lysates were prepared and then subjected to gel filtration analysis as in Figure 6H. The presence of caspase-2 in various fractions was monitored by immunoblots. The arrow indicates the position where the HMW complex would be expected. The occurrence of processed protease in the fractions 22–26, despite the absence of activated caspase-2 in the input sample again, suggests that processing occurs during the preparation for the gel filtration experiment. However, the absence of a signal in lane 12 shows that only caspase-2 modified in intact cells is capable of forming this HMW complex. (H) Scheme of PFT induced cell death pathways. Pore-forming toxin elicits various forms of cell death, depending on concentrations and cell types. PFT-mediated apoptosis in epithelial cells is dependent on caspase-2. Loss of caspase prevents PFT-mediated cell death, and potassium ion depletion contributes to caspase-2 activation, which is independent of PIDD and RAIDD (*=P<0.05, **=P<0.01, ***=P<0.005). Figure source data can be found with the Supplementary data.

References

    1. Abrami L, Fivaz M, Glauser PE, Sugimoto N, Zurzolo C, van der Goot FG (2003) Sensitivity of polarized epithelial cells to the pore-forming toxin aerolysin. Infect Immun 71: 739–746 - PMC - PubMed
    1. Abrami L, Fivaz M, van der Goot FG (2000) Adventures of a pore-forming toxin at the target cell surface. Trends Microbiol 8: 168–172 - PubMed
    1. Baliga BC, Read SH, Kumar S (2004) The biochemical mechanism of caspase-2 activation. Cell Death Differ 11: 1234–1241 - PubMed
    1. Bantel H, Sinha B, Domschke W, Peters G, Schulze-Osthoff K, Janicke RU (2001) Alpha-toxin is a mediator of Staphylococcus aureus-induced cell death and activates caspases via the intrinsic death pathway independently of death receptor signaling. J Cell Biol 155: 637–648 - PMC - PubMed
    1. Bhakdi S, Tranum-Jensen J (1991) Alpha-toxin of Staphylococcus aureus. Microbiol Rev 55: 733–751 - PMC - PubMed

Publication types