. 2012 Jun;53(2):113-24.
doi: 10.1007/s10858-012-9629-2. Epub 2012 Apr 25.

Selective editing of Val and Leu methyl groups in high molecular weight protein NMR

Affiliations

Selective editing of Val and Leu methyl groups in high molecular weight protein NMR

Weidong Hu et al. J Biomol NMR. 2012 Jun.

Abstract

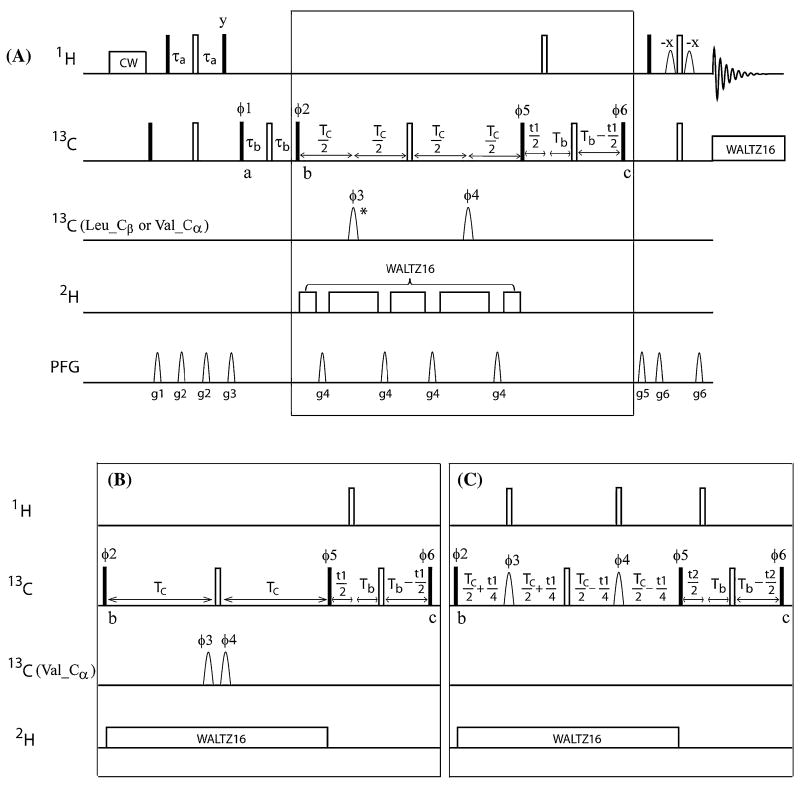
The development of methyl-TROSY approaches and specific (13)C-(1)H labeling of Ile, Leu and Val methyl groups in highly deuterated proteins has made it possible to study high molecular weight proteins, either alone or in complexes, using solution nuclear magnetic resonance (NMR) spectroscopy. Here we present 2-dimensional (2D) and 3-dimensional (3D) NMR experiments designed to achieve complete separation of the methyl resonances of Val and Leu, labeled using the same precursor, α-ketoisovalerate or acetolactate. The 2D experiment can further select the methyl resonances of Val or Leu based on the C(α) or C(β) chemical shift values of Val or Leu, respectively. In the 3D spectrum, the methyl cross peaks of Val and Leu residues have opposite signs; thus, not only can the residue types be easily distinguished, but the methyl pairs from the same residue can also be identified. The feasibility of this approach, implemented in both 2D and 3D experiments, has been demonstrated on an 82 kDa protein, malate synthase G. The methods developed in this study will reduce resonance overlaps and also facilitate structure-guided resonance assignments.


Figures

Fig. 1
Fig. 1
Pulse sequences for separating the methyl groups of Val and Leu in [L(13CH3, 13CH3), V(13CH3,13CH3)]-U-[15N, 13C, 2H]-protein samples. A The 2D V/L-CT-HmCm pulse scheme for detecting the methyl spectrum of Val or Leu separately. This scheme also allows detection of a subset of methyl groups based on the Cα chemical shift of Val or Cβ chemical shift of Leu. All radio frequency pulses are applied along the x-axis unless otherwise indicated. The hard 90° and 180° pulses on 1H and 13C are represented using filled and open rectangular bars, respectively. The field strengths for 1H pre-saturation, 13C WALTZ-16 (Shaka et al. 1983), and 2H WALTZ-16 decoupling are 12 Hz, 3.1 kHz and 1 kHz, respectively. The 13C carrier is put at 19.5 ppm first, and then switched to 43.5 ppm before the 13C pulse with phase φ1 at point “a.” Delays are τa = 1.8 ms; τb = 7 ms; TC = 14.25 ms and Tb = 7.5 ms. The phase cycling parameters are: φ1 = x, −x; φ2 = 2(y), 2(−y); φ3 = φ4 = 2(x), 2(−x), 2(y), 2(−y); φ5 = 4(y), 4(−y); φ6 = 8(x), 8(−x); rec = 8(x), 8(−x). Quadrature detection in t1 is achieved by incrementing φ6 using the STATES-TPPI scheme (Marion et al. 1989). The pulsed field gradients, g1 to g6, are applied along the z-axis with strengths (G/cm)/duration (ms) of: g1 = 11/1.0, g2 = 5.5/1.0, g3 = 16.6/1.0, g4 = 22/1.0, g5 = 39.5/0.5, g6 = 39.5/0.5. The durations of the selective 180° I-BURP pulses (Geen and Freeman 1991) with φ3 and φ4 are 2 ms for detecting all methyl groups of Val or Leu, and 12 ms for detecting a subset of methyl groups of Val or Leu. The I-BURP pulses are applied at 62 and −62 ppm alternately for two consecutive scans to detect all methyl groups of Val or Leu. To detect all methyl groups of Leu, the receiver phase cycling is changed to 4(x, −x), 4(−x, x), and the I-BURP pulse labeled with asterisk (φ3) is moved leftward 1.65 ms (see “Discussion” in text). B The 2D L-CT-HmCm pulse scheme optimized for detection of all methyl groups of Leu residues. Most of the parameters are the same as described in A, with the following changes: TC is set to 14.6 ms and the two 180° I-BURP pulses (φ3 and φ4) are replaced with two 90° E-BURP pulses applied at 62 ppm with a duration of 1.8 ms. The phase cycling parameters are φ1 = x, −x; φ2 = 2(y), 2(−y); φ3 = 2(y), 2(−y); φ4 = 4(x), 4(−x); φ5 = 4(y), 4(−y); φ6 = 8(x), 8(−x); rec = 4(x, −x), 4(−x, x). The STATES-TPPI scheme is applied on φ6 for quadrature detection in t1. (C) The 3D VL-CT-HmCmC pulse scheme used to correlate the Val and Leu methyl groups to the directly attached carbon. Most of the parameters are the same as described in A, with the following differences. TC is set to 14 ms. The phase cycling parameters are: φ1 = x, −x; φ2 = 2(y), 2(−y); φ3 = φ4 = 2(x), 2(−x), 2(y), 2(−y); φ5 = 4(y), 4(−y); φ6 = 8(x), 8(−x); rec = 4(x, −x), 4(−x, x). The quadrature detection uses the STATES-TPPI scheme in t1 on phase φ1 and φ2, and in t2 on φ6. The selective pulses with φ3 and φ4 are I-BURP on resonance applied at 62 ppm with a duration of 2 ms
Fig. 2
Fig. 2
Leu and Val-selective spectra acquired on [I(δ1-13CH3), L(13CH3, 13CH3), V(13CH3, 13CH3)]-U-[15N, 13C,2H]-MSG at 37 °C. A The methyl region of Val and Leu acquired using CT-HMQC for comparison. B The overlay of Leu- (red) and Val-selective (blue) methyl spectra acquired using the 2D L-CT-HmCm and the 2D V/L-CT-HmCm pulse schemes, respectively. Three overlapped positions are indicated with numbered arrows in both A and B. The two spectra are shown separately in (C, Leu) and (D, Val). The assignments at the three positions are indicated according to previously reported assignment (Gans et al. 2010; Tugarinov and Kay 2004b) and the overlapped Val and Leu resonances are resolved in the selective spectra C and D
Fig. 3
Fig. 3
Representative 2D planes of the 3D spectrum for MSG acquired using the 3D VL-CT-HmCmC experiment at 37 °C. Val (blue) and Leu (red) residues were distinguished based on their opposite signs. A Strip of the overlay of 2D Leu- and Val-selective spectra from Fig. 2B. B The 2D 13C–13C plane of the 3D spectrum with the 1H anchored at 0.42 ppm, indicated by the vertical line in A. C and D Representative 2D 13C–1H methyl correlation slices of the 3D data for C Val with the 13C (Cβ) dimension at 30.1 ppm and D Leu with the 13C (Cγ) dimension at 27.2 ppm
Fig. 4
Fig. 4
Full and representative sub-spectra of Val methyl cross peaks acquired using 2D V/L-CT-HmCm. A Full spectrum of Val methyl resonances. BD Sub-spectra acquired with a 12 ms I-BURP pulse applied at B 58, C 62.6 and D 65.6 ppm. The overlapped cross peaks in the outlined region in A are resolved in the sub-spectra shown in BD and their assignments are indicated. All insets are enlargements of the respective regions outlined in red
Fig. 5
Fig. 5
Full and sub-spectra of Leu methyl cross peaks acquired using 2D V/L-CT-HmCm. A Full spectrum of Leu methyl resonances. The circled region shows weak leakage from the strongest Val resonance (V581, see Fig. 4A) that is completely suppressed by the pulse scheme 2D L-CT-HmCm (Fig. 1B), as shown in Fig. 2C. BD Sub-spectra acquired with a 12 ms I-BURP pulse applied at B 37.4, C 39.5 and D 44.4 ppm. The overlapped cross peaks in the outlined region in A are mostly resolved in the different sub-spectra shown in BD and their assignments are indicated. All insets are enlargements of the respective regions outlined in red
Fig. 6
Fig. 6
Methyl peak intensity ratio between the sub and full spectra of Val versus the chemical shift of Cα of Val along with the simulated 12 ms I-BURP inversion profiles. The Cα chemical shifts were identified in a previous report (Tugarinov et al. 2002). The peak intensity ratio was normalized for each sub-spectra by defining the largest ratio within each sub spectra as 1.0. The intensity ratios are color coded according to the arrows at the top of the figure that correspond to the I-BURP irradiation frequencies of the different sub-spectra. The peaks indicated by diamond, times, triangle, and plus sign are from sub-spectra acquired with I-BURP pulses applied at 58, 62.6, 63.4 and 68.1 ppm, respectively for Val. The outlined box in the figure covers the chemical shift range 63 ± 0.7 ppm

References

    1. Delaglio F, Grzesiek S, Vuister GW, Zhu G, Pfeifer J, Bax A. NMRPipe: a multidimensional spectral processing system based on UNIX pipes. J Biomol NMR. 1995;6:277–293. - PubMed
    1. Gans P, Hamelin O, Sounier R, Ayala I, Dura MA, Amero CD, Noirclerc-Savoye M, Franzetti B, Plevin MJ, Boisbouvier J. Stereospecific isotopic labeling of methyl groups for NMR spectroscopic studies of high-molecular-weight proteins. Angew Chem Int Ed Engl. 2010;49:1958–1962. - PubMed
    1. Gardner KH, Kay LE. Production and incorporation of 15N, 13C, 2H (1H-δ1 methyl) isoleucine into proteins for multidimensional NMR studies. J Am Chem Soc. 1997;119:7599–7600.
    1. Geen H, Freeman R. Band-selective radiofrequency pulses. J Magn Reson. 1991;93:93–141.
    1. Gelis I, Bonvin AM, Keramisanou D, Koukaki M, Gouridis G, Karamanou S, Economou A, Kalodimos CG. Structural basis for signal-sequence recognition by the translocase motor SecA as determined by NMR. Cell. 2007;131:756–769. - PMC - PubMed

Publication types

LinkOut - more resources