. 2013 Aug;28(2):250-61.
doi: 10.1177/0885328212445404. Epub 2012 Apr 24.

Modifying three-dimensional scaffolds from novel nanocomposite materials using dissolvable porogen particles for use in liver tissue engineering

Affiliations

Modifying three-dimensional scaffolds from novel nanocomposite materials using dissolvable porogen particles for use in liver tissue engineering

Hussamuddin Adwan et al. J Biomater Appl. 2013 Aug.

Abstract

Background: Although hepatocytes have a remarkable regenerative power, the rapidity of acute liver failure makes liver transplantation the only definitive treatment. Attempts to incorporate engineered three-dimensional liver tissue in bioartificial liver devices or in implantable tissue constructs, to treat or bridge patients to self-recovery, were met with many challenges, amongst which is to find suitable polymeric matrices. We studied the feasibility of utilising nanocomposite polymers in three-dimensional scaffolds for hepatocytes.

Materials and methods: Hepatocytes (HepG2) were seeded on a flat sheet and in three-dimensional scaffolds made of a nanocomposite polymer (Polyhedral Oligomeric Silsesquioxane [POSS]-modified polycaprolactone urea urethane) alone as well as with porogen particles, i.e. glucose, sodium bicarbonate and sodium chloride. The scaffold architecture, cell attachment and morphology were studied with scanning electron microscopy, and we assessed cell viability and functionality.

Results: Cell attachment to the scaffolds was demonstrated. The scaffold made with glucose particles as porogen showed a narrower range of pore size with higher porosity and better inter-pore communications and seemed to encourage near normal cell morphology. There was a steady increase of albumin secretion throughout the experiment while the control (monolayer cell culture) showed a steep decrease after day 7. At the end of the experiment, there was no significant difference in viability and functionality between the scaffolds and the control.

Conclusion: In this initial study, porogen particles were used to modify the scaffolds produced from the novel polymer. Although there was no significance against the control in functionality and viability, the demonstrable attachment on scanning electron microscopy suggest potential roles for this polymer and in particular for scaffolds made with glucose particles in liver tissue engineering.

Keywords: HepG2; POSS-modified polycaprolactone urea urethane; hepatocytes; nanocomposite polymers; porogens; scaffolds; tissue engineering.


Figures
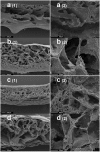
Figure 1.
Figure 1.
Scanning electron microscopy (SEM) at (1) 40 and (2) 320 times magnifications of transverse sections of the 3D scaffolds: (a) polycaprolactone urea urethane (PU), (b) polymer with glucose (PG), (c) sodium bicarbonate (PB) and (d) sodium chloride (PN). The pores and the wall thickness are largest in PU and finest in PB while PN shows a distinct layer of fine pores on top of a layer of much larger pore sizes. Only PG demonstrated a nearly uniformal mixture of pore sizes which is neither very large nor very small, along with a narrower range of wall thickness and more interpore communications. Although PB at higher magnification demonstrated higher interpore communications, the overall pore sizes were either too small or too large, rendering their support to cells and their influence on hepatocytes’ proliferation less uniformal and hence less predictable.
Figure 2.
Figure 2.
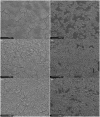
Scanning electron microscopy (SEM) at 80 times magnification on Day 5, 8 and 10 (1, 2 and 3, respectively) comparing hepatocytes’ confluence and proliferation on (a) PMS and (b) Melinex. The rate of proliferation of hepatocytes on PMS seems similar if not higher than on Melinex as indicated by the near complete cell confluence on Day 8 on PMS. The cracks noted between cell aggregates on PMS on Day 8 and 10 could be a combination of the alcohol dehydration process used to prepare the slides for SEM and an overlap of cell growth.
Figure 3.
Figure 3.
Scanning electron microscopy (SEM) at 640 (a) and (b) and at 2500 magnifications (c) and (d) on culture Day 3 on PMS. HepG2 hepatocytes seem to retain their phenotypical hexagonal appearance. Cell-cell and cell-matrix attachments on PMS can also be observed especially around the peripheries of cell clusters and with more clarity in (d).
Figure 4.
Figure 4.
Scanning electron microscopy (SEM) at 2500 magnification demonstrating cell-cell and cell-matrix attachment on culture Day 7 of HepG2 in the three-dimensional (3D) nanocomposite scaffolds: POSS-modified polycaprolactone urea urethane (PU) (a) and its porogen modifications, i.e. with glucose particles (PG) (b), with sodium bicarbonate particles (PB) (c) and with sodium chloride particles (PN) (d). The cell surface looks smoother and has less granulation in PU and in PG. The cracks within HepG2 sheets could have been from the alcohol dehydration process during sample preparation for SEM.
Graph 1.
Graph 1.
Summary graphs representing the results of alamarBlue® assay: (a) Examining PMS in 2D cultures against two different controls, in Meliniex and in tissue culture plates (TCPs). Although fluorescence intensity (FI) emissions were higher from control in Melinex and in TCP than from PMS, there was little, if any, difference between the two controls and both controls exhibit a similar graph trend, rendering control in Melinx as a suitable alternative for control in TCP, especially for scanning electron microscope (SEM) examination. FI emission from PMS was significantly higher on culture D5 and D8 when compared to D1, suggesting PMS capacity to maintain hepatocytes for that period. Although FI emissions from control in TCP were significantly higher (*) than from PMS on culture D2, D5 and D10 (mean FI percentage difference was 45.22, 57.79 and 48.54, respectively), and FI emissions from control in Melinex were significantly higher (**) than from PMS on culture D3 and D8 (mean FI percentage difference was 55.89 and 58.89, respectively), the graph trend of FI emissions exhibited from PMS is similar to that demonstrated by control in TCP and in Melinex. (b) Examining the three-dimensional (3D) scaffolds and their control in TCP, FI emissions from control in TCP were significantly higher than emissions from the scaffolds throughout the experiment, which could be explained by the leak of the homogenised cell solution at the beginning of the experiment (FI percentage difference of the means on culture D1 between TCP and polymer with glucose (PG), sodium bicarbonate (PB), sodium chloride (PN) and polycaprolactone urea urethane (PU) was 35.12, 19.31, 42.48 and 21.95, respectively). However, all 3D scaffolds continue to demonstrate FI emission on alamarBlue up to culture D14, suggesting their capacity to maintain hepatocytes for the length of the experiment. This is further supported by the reduction in the difference of FI emission (i.e. larger FI percentage difference) between most of the scaffolds and control in TCP (FI percentage difference of the means on culture D14 between TCP and PG, PB, PN and PU was 44.78, 54.33, 36.66 and 47.74, respectively).
Graph 2.
Graph 2.
A bar chart and a graph representing PicoGreen assay reflecting the relative quantity of HepG2 cells in cultures as indicated by quantifying FI emissions of released cellular DNA’s following induced cell destruction. (a) Comparison between fluorescence intensity (FI) emission from PMS and control in tissue culture plates (TCP) and in Melinex on culture D10 (at the end of the initial experiment). Although, mean FI emission from PMS was lower than from control in Melinex and significantly lower than from control in TCP (46.74, 50.65 and 57.59 U/L respectively; Kruskal-Wallis p = 0.0183; Dunn’s multiple comparison test p < 0.05 for PMS vs. TCP), the difference between the three cultures on PicoGreen was much less than the difference found on alamarBlue (i.e. higher FI percentage difference: 92.28 for PMS vs. Melinex and 81.16 for PMS vs. TCP). (b) A graph comparing FI emissions from each of the 3D scaffolds with each other and with control in TCP on culture D7 and D14. Factoring in the initial low count of HepG2 cells at the beginning of the experiment (due to the small unquantifiable leak of the homogenised solution at the time of seeding), a higher but non-significant FI emission from control in TCP than from the scaffolds was anticipated. However, FI emissions were higher on culture D14 than on D7 across all the 3D scaffolds suggesting progressive increase in HepG2 cell count and the maintenance of viable cell culture for the duration of the experiment.
Graph 3.
Graph 3.
Summary graphs representing aspartate transferase (AST), albumin and urea synthesis (a, b and c, respectively) from seeded 3D scaffolds on culture Day 1, 3, 7 and 14. AST is not commonly used to study static tissue culture. Unlike albumin and urea synthesis where a high level reflects progressive proliferation of functioning hepatocytes, a high AST level should indicate an increased number of damaged hepatocytes. Hence by simple deduction, continuous synthesis of AST requires progressive hepatocyte proliferation. This could explain the rapid decline following the initial steady rise. The coincidental rapid decline of albumin secretion from control in TCP detected on culture D14 after its initial increase on culture D7 would support this analogy (3.0, 14.125 and 8.0 U/L mean AST release vs. 680.81, 15,259 and 9467.95 ng/ml mean albumin secretion from control in TCP on culture D1, 7 and 14, respectively). The AST (a) and similarly albumin synthesis (b) exhibited plateau from 3D scaffolds after culture D7 would indirectly suggest progressive proliferation of functioning hepatocytes. This is further supported by the gradual increase in urea synthesis across all scaffolds (c). In all these experiments, AST, albumin secretion and urea synthesis were all higher from PG scaffolds when compared to other scaffolds (highest on culture D7). The higher levels detected from control in TCP possibly reflects the initial small unquantifiable loss of homogenised cell solution at the time of cell seeding into 3D scaffolds.

Similar articles

Cited by

References

    1. Facts about liver disease, http://www.britishlivertrust.org. uk/data/5/pages/2 aspx?pid=280 (2008). (accessed 31 January 2008)
    1. Standards for solid organ transplantation in the United Kingdom, http://www.bts.org.uk/Forms/standards%20document%20edition%202%20-%20final pdf (2003 July). (accessed 31 January 2008)
    1. Transplant activity in the UK, http://www.uktransplant. org.uk/ukt/statistics/transplant_activity_report/current_activity_report... pdf (2007 August). (accessed 31 January 2008)
    1. Vienken J, Christmann H. How can liver toxins be removed? Filtration and adsorption with the Prometheus system. Ther Apher Dial 2006; 10(2): 125–131 - PubMed
    1. Laleman W, Wilmer A, Evenepoel P, et al. Review article: non-biological liver support in liver failure. Aliment Pharmacol Ther 2006; 23(3): 351–363 - PubMed

Publication types