. 2012 Oct 10;21(15):2852-65.
doi: 10.1089/scd.2011.0676. Epub 2012 Jul 9.

The expression of the glucocorticoid receptor in human erythroblasts is uniquely regulated by KIT ligand: implications for stress erythropoiesis

Affiliations

The expression of the glucocorticoid receptor in human erythroblasts is uniquely regulated by KIT ligand: implications for stress erythropoiesis

Lilian Varricchio et al. Stem Cells Dev. .

Abstract

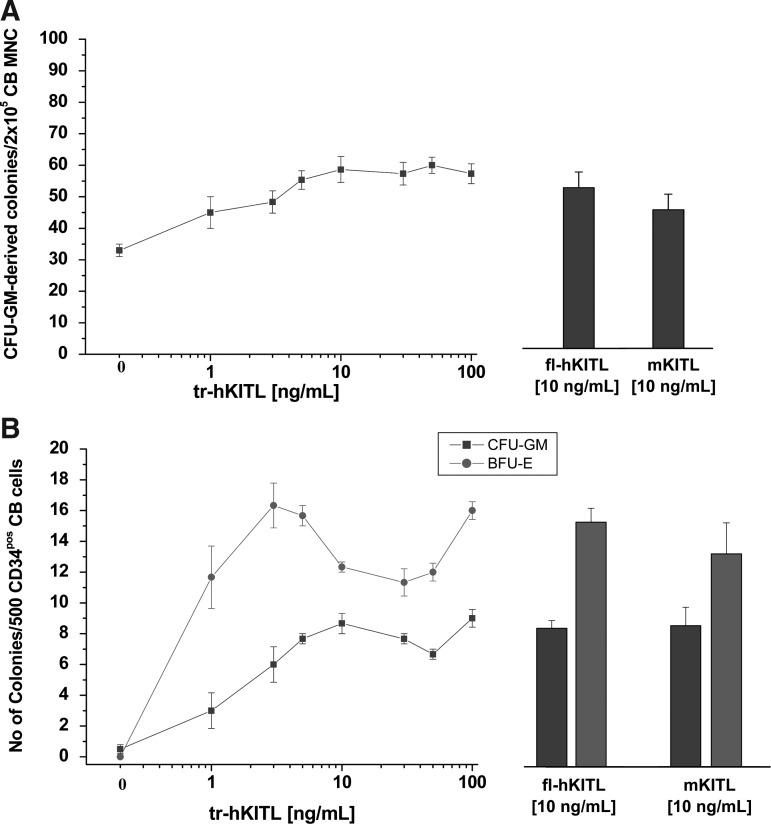
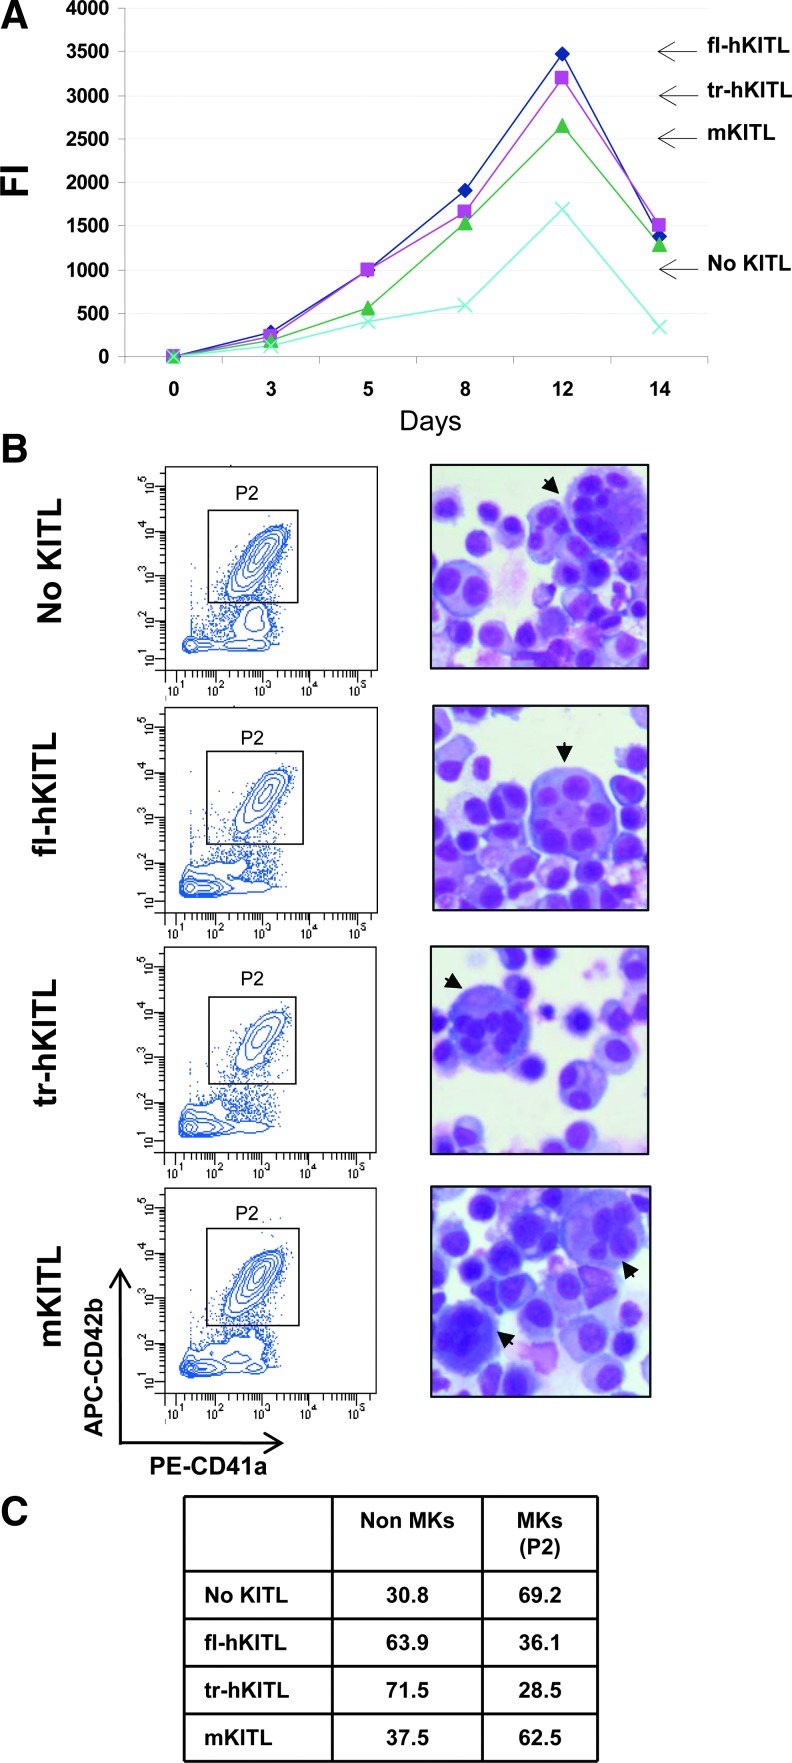
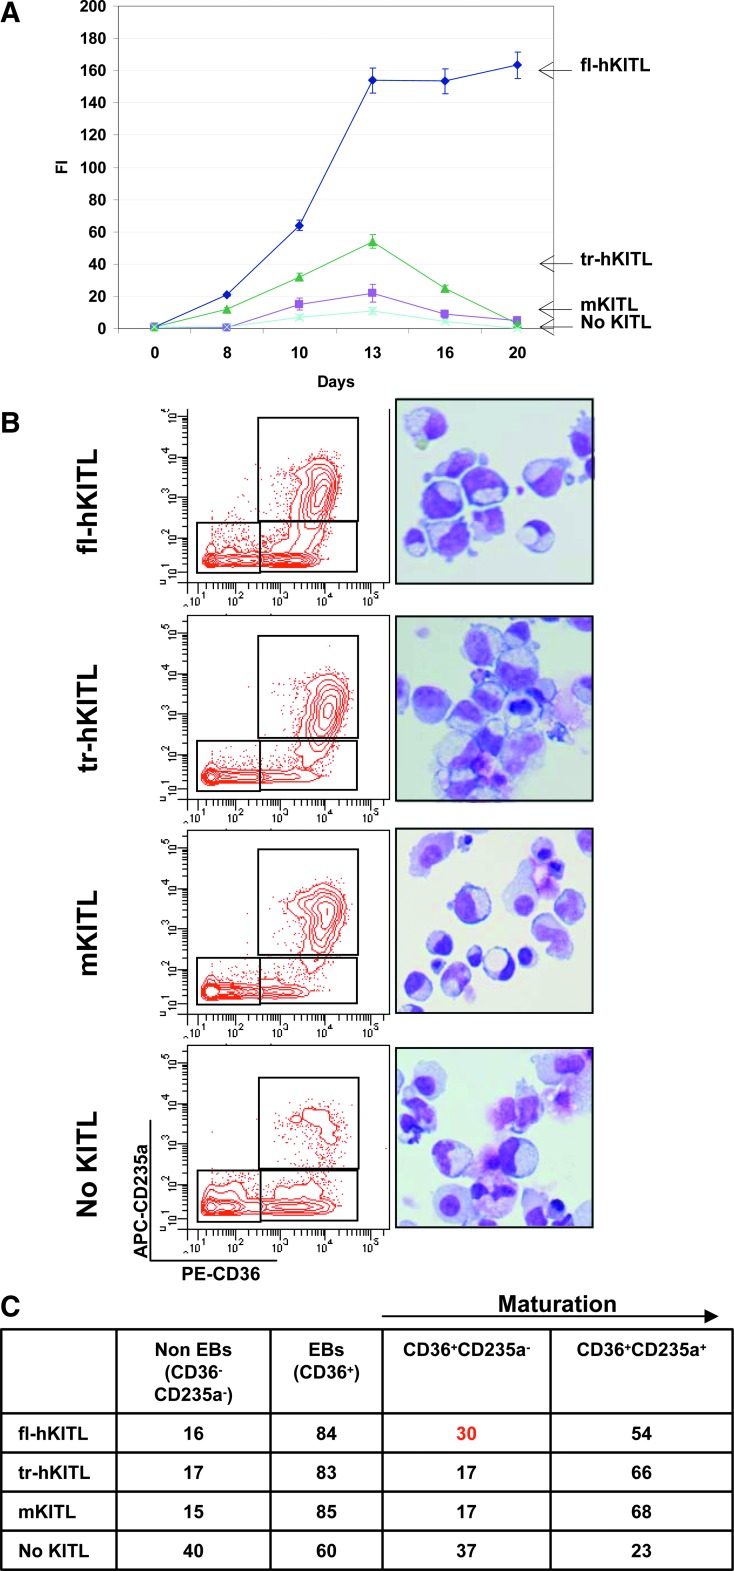
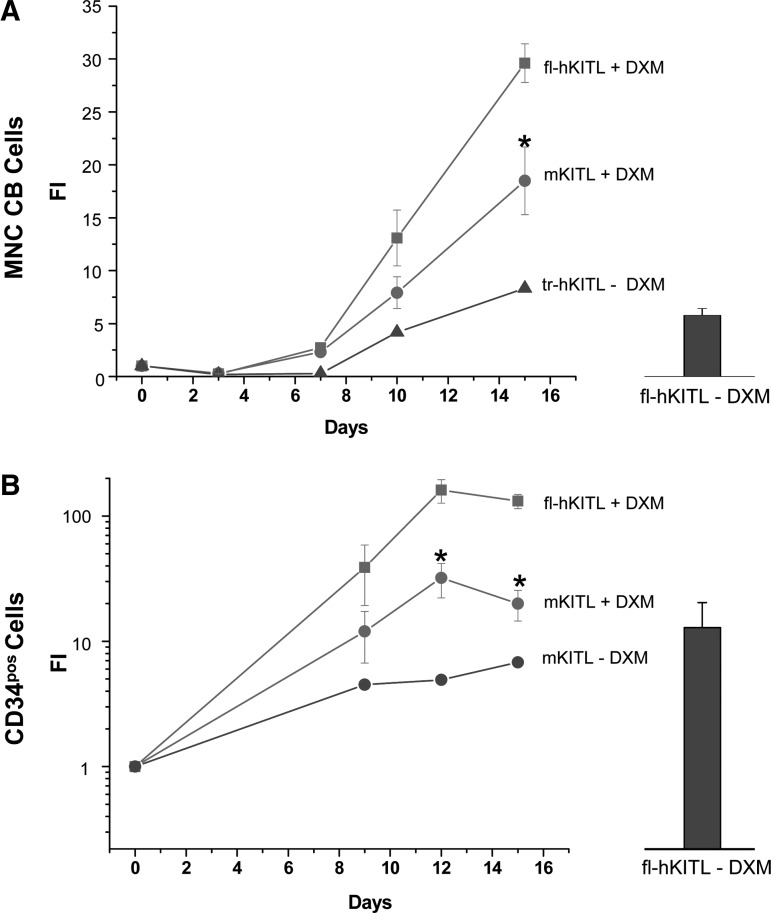
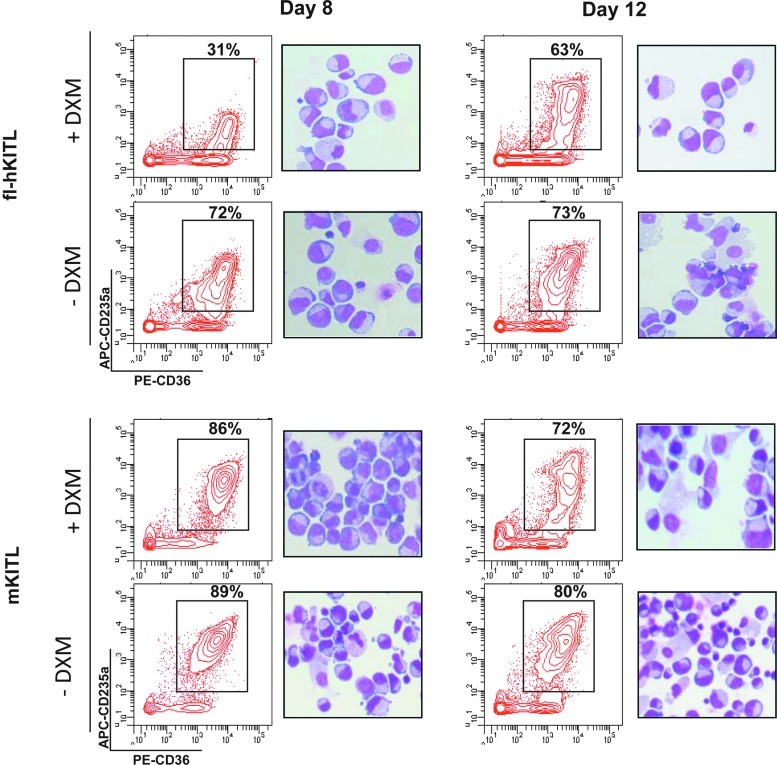
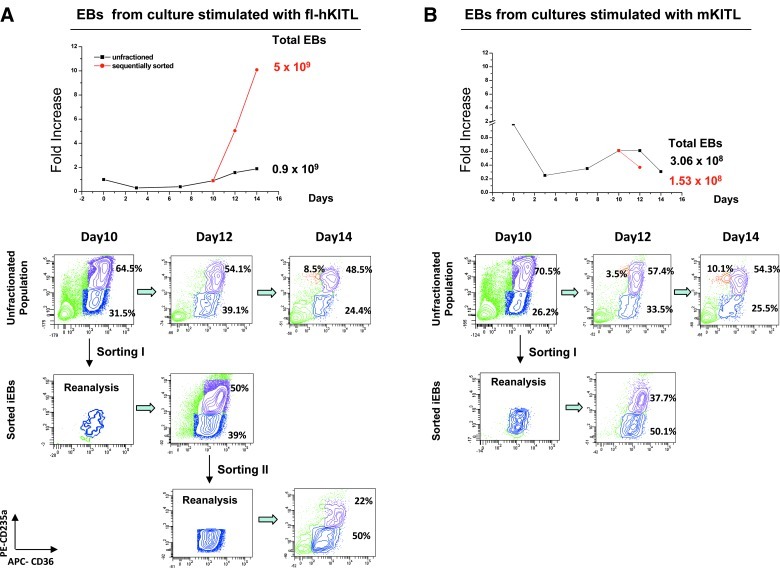
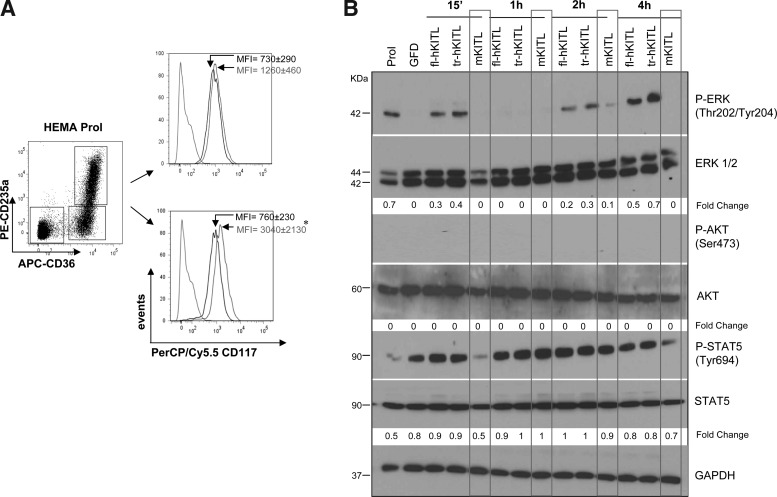
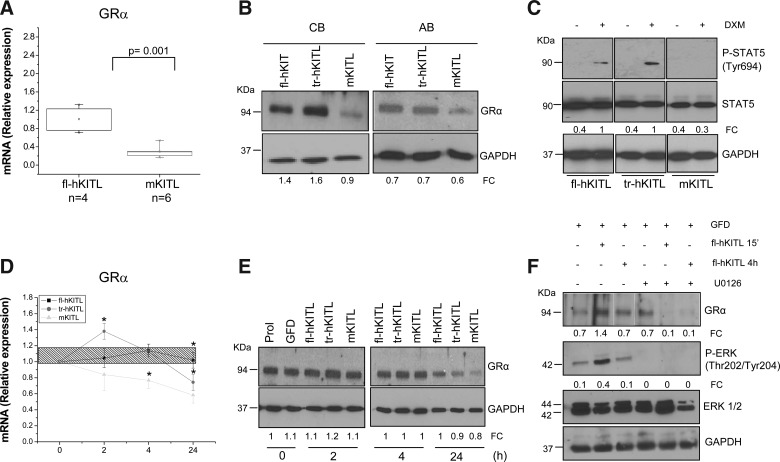
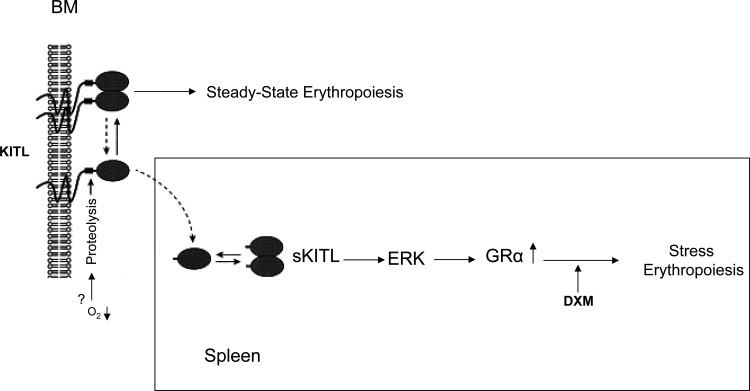
Studies in mice indicated that activation of the erythroid stress pathway requires the presence of both soluble KIT ligand (KITL) and the glucocorticoid receptor (GR). To clarify the relative role of KITL and GR in stress erythropoiesis in humans, the biological activities of soluble full length- (fl-, 26-190 aa), carboxy-terminus truncated (tr-, 26-162 aa) human (hKITL) and murine (mKITL) KITL in cultures of cord blood (CB) mononuclear cells (MNCs) and CD34(pos) cells that mimic either steady state (growth factors alone) or stress (growth factors plus dexamethasone [DXM]) erythropoeisis were investigated. In steady state cultures, the KITLs investigated were equally potent in sustaining growth of hematopoietic colonies and expansion of megakaryocytes (MK) and erythroid precursors (EBs). By contrast, under stress erythropoiesis conditions, fl-hKITL generated greater numbers of EBs (fold increase [FI]=140) than tr-hKITL or mKITL (FI=20-40). Flow cytometric analyses indicated that only EBs generated with fl-hKITL remained immature (>70% CD36(pos)/CD235a(neg/low)), and therefore capable to proliferate, until day 8-12 in response to DXM. Signaling studies indicated that all KITLs investigated induced EBs to phosphorylate signal transducer and activator of transcription 5 (STAT5) but that extracellular-signaling-regulated-kinases (ERK) activation was observed mainly in the presence of fl-hKITL. EBs exposed to fl-hKITL also expressed higher levels of GRα than those exposed to mKITL (and tr-hKITL) which were reduced upon exposure to the ERK inhibitor U0126. These data reveal a unique requirement for fl-hKITL in the upregulation of GRα and optimal EB expansion in cultures that mimic stress erythropoiesis.


Figures

FIG. 1.
FIG. 1.
tr-hKITL is as potent as fl-hKITL and mKITL in sustaining the growth of CFU-GM- and BFU-E-derived colonies from CB MNCs and CD34pos cells. (A) tr-hKITL concentration/response curve for CFU-GM-derived colonies from CB MNCs. Results are compared with those obtained in parallel cultures stimulated with optimal concentrations of fl-hKITL and mKITL (10 ng/mL for both, bar graphs on the right). (B) tr-KITL concentration/response curves for CFU-GM- (squares) and BFU-E-derived colonies (circles) from CB CD34pos cells. The number of erythroid bursts (light gray bars) and granulo-monocytic colonies (dark gray bars) generated by CD34pos cells in the presence of either fl-hKITL or mKITL (10 ng/mL for both) are presented on the right, for comparison. Results are presented as mean (±SD) of 3 independent experiments. hKITL, human KIT ligand; tr, carboxy-terminus truncated; fl, full length; mKITL, murine KIT ligand; CFU, colony-stimulating factor; GM, granulocyte-macrophage; CB, cord blood; MNC, mononuclear; BFU-E, burst forming unit-erythroid; SD, standard deviation.
FIG. 2.
FIG. 2.
fl-hKITL, tr-hKITL, and mKITL are equally potent in sustaining MK and EB expansion from CB CD34pos cells in cultures not supplemented with DXM. (A) Growth curves of CB CD34pos cells cultured for up to 14 days in the presence of IL-3 and TPO alone (no KITL, blue) or with either fl-hKITL (black), tr-hKITL (red), or mKITL (green) (50 ng/mL in all cases), as indicated. Data are expressed as FI with respect to the numbers of CD34pos cells seeded at day 0. (B) FACS profile for CD41a and CD42b expression (on the left) and morphology (by May-Grunwald staining, on the right) of cells obtained after 12 days in cultures. Arrowheads indicate representative MKs. Magnification 40×. (C) Frequency of MK and non-MK populations (mostly EBs) in the flow cytometric analysis shown in (B). MK, megakaryocytic; EBs, erythroid precursors; DXM, dexamethasone; IL, interleukin; FI, fold increase.
FIG. 3.
FIG. 3.
fl-hKITL is superior to both tr-hKITL and mKITL in sustaining ex vivo amplification of EBs from CB MNCs in cultures containing DXM (HEMA conditions). (A) Growth curves of EBs in cultures stimulated with DXM, estradiol, IL-3, and EPO but without KITL (blue) or with fl-hKITL (black), tr-hKITL (purple), or mKITL (green), as indicated. Data are expressed as FI with respect to the number of cells seeded at day 0. Results are shown as mean (±SD) of 3 separate experiments. (B) FACS profile for CD36 and CD235a expression (on the left) and morphology (by May-Grunwald staining, on the right) of cells obtained after 13 days in culture. Magnification 40×. (C) Frequency of non-EBs (CD36negCD235aneg/low cells), total EBs (CD36pos cells), and immature (CD36posCD235aneg/low) and mature (CD36posCD235apos) EBs in the flow cytometry analysis is presented in (B). Results from a representative experiment are shown (see also Fig. 4). HEMA, human erythroid massive amplification; EPO, erythropoietin.
FIG. 4.
FIG. 4.
fl-hKITL is superior to mKITL in sustaining EB expansion from both CB MNCs and CD34pos cells in cultures containing DXM (HEMA cultures). Growth curves of EBs in HEMA cultures of CB MNCs (top panel) and CD34pos cells (bottom panel) stimulated with either fl-hKITL (squares) or mKITL (circles). Growth curves observed in cultures stimulated with fl-hKITL (top panel) or mKITL (bottom panel) but without DXM are presented as controls. Results are expressed as FI and are presented as mean (±SD) of 3 separate experiments with 3 separate donors and are compared with average FI obtained in cultures stimulated with fl-hKITL, IL-3, and EPO but not DXM (columns on the right) as previously published [3,4]. FI that is statistically different (P<0.01) between DXM-stimulated cultures stimulated with fl-hKITL or mKITL is indicated by asterisks.
FIG. 5.
FIG. 5.
Addition of DXM retards EB maturation in HEMA cultures stimulated with fl-hKITL but not in those stimulated with mKITL. Representative flow cytometry (for CD36/CD235a expression) and morphology (by May-Grunwald staining) of EBs generated by CB CD34pos cells at days 8 and 12 in cultures stimulated with either fl-hKITL or mKITL without or with DXM. Similar results were observed in 2 additional experiments (see also Fig. 4). Magnification 40×. APC, allophycocyanin; PE, phycoerythrin.
FIG. 6.
FIG. 6.
Comparison of the proliferation potential of immature EBs generated by day 10 in HEMA cultures stimulated with either fl-hKITL (A) or mKITL (B). Top panels: Growth curves of adult MNCs in HEMA culture (squares) stimulated with either fl-hKITL (A) or mKITL (B) and of the corresponding immature day 10 EBs sequentially sorted (every 2 days) and expanded in culture again (circles). The theoretical number of EBs generated from the MNCs from an entire blood donation cultured under the various conditions is presented on the right (total EBs). Bottom panels: Maturation profile (CD36/CD235a staining) of the day 10–14 progeny of adult MNCs and of the sorted populations. Immature EBs generated in the presence of fl-hKITL could be sorted and re-cultured twice generating great numbers of erythroid cells while those generated with mKITL could be purified and cultured only once due to lack of growth.
FIG. 7.
FIG. 7.
Day 10 EBs express high levels of cKIT and respond to hKITL (both fl-hKITL and tr-hKITL) but not mKITL by activating both the rapid and the sustained ERK pathway. (A) Representative flow cytometric analysis for the expression of cKIT (CD117) of immature (bottom panel) and mature (upper panel) EBs. EBs were obtained at day 10 of HEMA cultures stimulated with fl-hKITL and divided into immature and mature populations on the basis of the CD36CD235a gates presented on the left. Cells were analyzed either as obtained from the culture (black histogram) or after 2 h of GFD (gray histogram). The dotted histogram indicates the isotype control. The MFI (±SD) CD117 expression observed in 5 separate experiments is indicated within the quadrants (*P<0.05). (B) Levels of ERK, STAT5, and AKT phosphorylation in CB EBs obtained at day 10 of fl-hKITL-stimulated HEMA cultures (Prol) and then GFD for 4 h and treated with fl-hKITL, tr-hKITL, or mKITL for 15 min, 1, 2, or 4 h, as indicated. Levels of total STAT5, AKT, ERK, and GAPDH expression were analyzed as quantitative control. The intensity of the bands corresponding to the phosphorylated and total form of each protein was quantified by densitometry and expressed as fold change below each line, for comparison. GFD, growth factor deprived; MFI, mean fluorescent intensity; GAPDH, glyceraldehyde 3-phosphate dehydrogenase.
FIG. 8.
FIG. 8.
fl-hKITL regulates the expression of GRα in human EBs. (A) Quantitative RT-PCR of the levels of GRα mRNA expressed by day 10 EBs generated in HEMA cultures stimulated with either hKITL or mKITL, as indicated. The number of independent experiments included in the analyses (each one with a different donor) is indicated by n. mRNA levels are presented in relative units calculated using the average 2−ΔCt observed with EBs generated with fl-hKITL as 1. (B) WB analysis for GRα protein content of day 10 EBs generated in the presence of fl-hKITL, tr-hKITL, and mKITL, as indicated. Two representative experiments, 1 with CB-derived and 1 with AB-derived EBs are presented. GAPDH was analyzed as loading control. For further details see legend of Fig. 7. (C) Levels of STAT5 phosphorylation expressed by day 10 EBs obtained in HEMA cultures stimulated with either fl-hKITL, tr-hKITL, or mKITL and then exposed or not to DXM for 15 min. (D) Quantitative RT-PCR and (E) western blot analysis of the levels of GRα mRNA and protein expressed by day 10 EBs generated in HEMA cultures stimulated with fl-hKITL [shaded area in (C) and Prol in (D)], GFD for 4 h (time 0), and then exposed to either fl-hKITL, tr-hKITL, or mKITL (50 ng/mL in all cases) for up to 4 h as indicated. mRNA and protein levels were analyzed on the same cells. mRNA levels are expressed in relative units using 2−ΔCt obtained with GFD EBs as 1 and presented as mean (±SD) of 3 separate determinations. Asterisk (*) indicates <0.01 with respect to the corresponding values observed with fl-hKITL. (F) Western blot analysis of the levels of GRα, phospho-extracellular signal regulated kinases (P-ERK), and total ERK 1/2 and GAPDH (as loading control) in day 10 EBs generated in the presence of fl-hKITL, and exposed to GFD for 4 h. In some of the samples, the last hour of GFD occurred in the presence of U0126 (100 μM). GFD with or without U0126 EBs was then exposed to fl-hKITL for 15 min and 1 h, as indicated. The FC of the various bands with respect to the levels of GAPDH is also indicated. Similar results were observed in a separate experiment. GR, glucocorticoid receptor; RT-PCR, real-time polymerase chain reaction; AB, adult blood.
FIG. 9.
FIG. 9.
A model for the regulation of stress erythropoiesis based on the exquisite role of fl-hKITL as regulator of GR expression in human EBs. Under steady state conditions, erythropoiesis is regulated by membrane-bound hKITL and is GR independent. Microenvironmental cues activated by a stress signal activate the proteolytic cleavage of hKITL and fl-hKITL that are released in the plasma. Soluble fl-hKITL, although less efficient than the membrane-bound growth factor to activate the signal cascade [46], is uniquely capable, possibly through the ERK pathway, of activating GRα expression, making EBs responsive to glucocorticoids.

Similar articles

Cited by

References

    1. Papayannopoulou T. Migliaccio AR. Abkowitz JL. D'Andrea AD. Biology of erythropoiesis, erythroid differentiation, and maturation. In: Hoffman R, editor; Benz EJ, editor; Shattil S, editor. Hematology: Basic Principles and Practise. 5. Churchill Livingstone; New York: 2009. pp. 276–294.
    1. Besmer P. Kit-ligand-stem cell factor. In: Garland JM, editor; Quesenberry PJ, editor; Hilton DJ, editor. Colony-Stimulating Factors: Molecular and Cellular Biology. Marcel Dekker; New York: 1997. pp. 369–404.
    1. Migliaccio G. Migliaccio AR. Druzin ML. Giardina PJ. Zsebo KM. Adamson JW. Effects of recombinant human stem cell factor (SCF) on the growth of human progenitor cells in vitro. J Cell Physiol. 1991;148:503–509. - PubMed
    1. Migliaccio G. Migliaccio AR. Druzin ML. Giardina PJ. Zsebo KM. Adamson JW. Long-term generation of colony-forming cells in liquid culture of CD34+ cord blood cells in the presence of recombinant human stem cell factor. Blood. 1992;79:2620–2627. - PubMed
    1. Tajima Y. Moore MA. Soares V. Ono M. Kissel H. Besmer P. Consequences of exclusive expression in vivo of Kit-ligand lacking the major proteolytic cleavage site. Proc Natl Acad Sci U S A. 1998;95:11903–11908. - PMC - PubMed

Publication types

MeSH terms

LinkOut - more resources