. 2012 Aug;22(8):1499-511.
doi: 10.1101/gr.130922.111. Epub 2012 Apr 13.

Genome sequencing reveals complex speciation in the Drosophila simulans clade

Affiliations

Genome sequencing reveals complex speciation in the Drosophila simulans clade

Daniel Garrigan et al. Genome Res. 2012 Aug.

Abstract

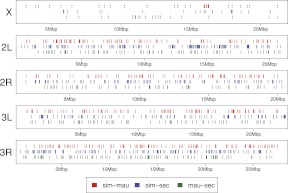
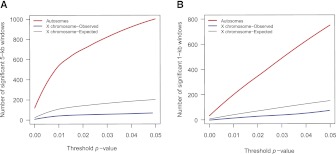
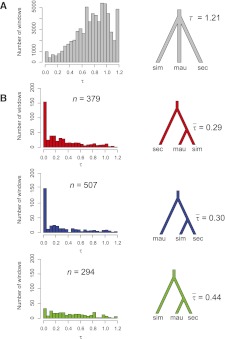
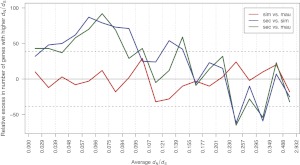
The three species of the Drosophila simulans clade--the cosmopolitan species, D. simulans, and the two island endemic species, D. mauritiana and D. sechellia--are important models in speciation genetics, but some details of their phylogenetic and speciation history remain unresolved. The order and timing of speciation are disputed, and the existence, magnitude, and timing of gene flow among the three species remain unclear. Here we report on the analysis of a whole-genome four-species sequence alignment that includes all three D. simulans clade species as well as the D. melanogaster reference sequence. The alignment comprises novel, paired short-read sequence data from a single highly inbred line each from D. simulans, D. mauritiana, and D. sechellia. We are unable to reject a species phylogeny with a basal polytomy; the estimated age of the polytomy is 242,000 yr before the present. However, we also find that up to 4.6% of autosomal and 2.2% of X-linked regions have evolutionary histories consistent with recent gene flow between the mainland species (D. simulans) and the two island endemic species (D. mauritiana and D. sechellia). Our findings thus show that gene flow has occurred throughout the genomes of the D. simulans clade species despite considerable geographic, ecological, and intrinsic reproductive isolation. Last, our analysis of lineage-specific changes confirms that the D. sechellia genome has experienced a significant excess of slightly deleterious changes and a dearth of presumed favorable changes. The relatively reduced efficacy of natural selection in D. sechellia is consistent with its derived, persistently reduced historical effective population size.


Figures

Figure 1.
Figure 1.
Sampling of phylogenetic trees. Three maximum likelihood trees with branch lengths that are estimated under a GTR model of nucleotide substitution. The trees are reconstructed from all aligned sites in the genome (A), all aligned sites from the mitochondrial genome (B), and a 15-kb region on chromosome 3R (C) (D. melanogaster reference coordinates 3R: 16,675,000–16,690,000) that includes the Ir93a and CG3822 ionotropic glutamate receptor genes. The asterisk on the interior branch in panel A indicates that this branch length can be regarded as statistically greater than zero; the resulting node has 100% bootstrap support.
Figure 2.
Figure 2.
Spacing of putatively introgressed 1-kb windows for each major chromosomal arm. (Red lines) The position of a putatively introgressed 1-kb window between D. simulans and D. mauritiana. (Blue lines) The position of putatively introgressed windows between D. simulans and D. sechellia. (Green lines) The position of windows of putative introgression between D. mauritiana and D. sechellia.
Figure 3.
Figure 3.
The number of genomic windows that reject the global allopatric model. Results of the likelihood ratio test comparing globally best-fitting allopatric model parameters versus locally best-fitting parameters in both 5-kb windows (A) and 1-kb windows (B) across both the autosomes (red lines) and the X chromosome (blue lines). The number of windows that reject the global model parameters, after correction for multiple tests, is plotted as a function of the threshold P-value that is used to determine significance (see Results section for additional explanation). (Black lines) The expected number of significant windows on the X chromosome, calculated as the product of the number of significant windows on the autosomes and the ratio of the total length of the X chromosome and autosomal alignments. This illustrates a dearth of windows on the X chromosome that are able to reject a strictly allopatric model, given any level of statistical significance.
Figure 4.
Figure 4.
Test for complex speciation. (A) For the autosomes, the globally best-fitting model is a polytomy with a divergence time of TA = 1.21 × 2Nsim,A generations before the present, while for the X chromosome it is also a polytomy with TX = 1.72 × 2Nsim,X generations. This corresponds to ∼242,000 yr ago for the autosomal data set. (B) Divergence time between pairs of species is allowed to be <1.21 × 2Nsim,A generations in 1-kb windows across the autosomes. Windows that reject the globally best-fitting model in favor of a more recent divergence time are shown. A total of 379 of autosomal windows support a more recent divergence time between D. simulans and D. mauritiana (31 for the X chromosome), while 507 autosomal windows support a more recent divergence time between D. simulans and D. sechellia (27 for the X). Lastly, 294 autosomal windows support a more recent divergence time between D. mauritiana and D. sechellia (22 for the X). This set of results does not correct for multiple tests, and ∼30% of the windows shown are expected to be false positives.
Figure 5.
Figure 5.
Reduced efficacy of selection in D. sechellia. A total of 7008 autosomal genes are binned according to level of selective constraint as measured by the average dN/dS between the inferred ancestor and each species. In each bin, three sign tests are performed to determine whether, for a given species pair, one species has significantly more genes with higher dN/dS. (Y-axis) Relative excess of genes with higher dN/dS for the first species in the pair. For example, in the first bin, D. simulans has 185 genes with higher dN/dS than D. mauritiana, while D. mauritiana has 175 genes with a higher dN/dS value. The difference, 10, is plotted. Values outside the region delimited by the dashed lines are significant for the sign test. D. sechellia tends to have higher dN/dS values in genes with high constraint (dN/dS < 0.155) and lower dN/dS in genes that experience positive selection or less constraint (dN/dS > 0.230). There is no significant difference between D. simulans and D. mauritiana for any of the bins.
Figure 6.
Figure 6.
Relative rates of evolution of four functional classes of mutation. Top panel shows rates for the autosomes, while bottom panel shows rates for the X chromosome. For each pair of species, we calculated the relative excess in the number of changes in species 1 compared with species 2 (see Methods). The functional classes are listed in order of increasing selection coefficient.

References

    1. Ai M, Min S, Grosjean Y, Leblanc C, Bell R, Benton R, Suh GSB 2010. Acid sensing by the Drosophila olfactory system. Nature 468: 691–695 - PMC - PubMed
    1. Akashi H, Schaeffer SW 1997. Natural selection and the frequency distributions of “silent” DNA polymorphism in Drosophila. Genetics 146: 295–307 - PMC - PubMed
    1. Altschul SF, Gish W, Miller W, Myers EW, Lipman DJ 1990. Basic local alignment search tool. J Mol Biol 215: 403–410 - PubMed
    1. Aubert J, Solignac M 1990. Experimental evidence for mitochondrial DNA introgression between Drosophila species. Evolution 44: 1272–1282 - PubMed
    1. Ballard JW 2000a. Comparative genomics of mitochondrial DNA in members of the Drosophila melanogaster subgroup. J Mol Evol 51: 48–63 - PubMed

Publication types

LinkOut - more resources