. 2012 Jun 8;110(12):1604-17.
doi: 10.1161/CIRCRESAHA.111.261768. Epub 2012 Apr 24.

A novel role for type 1 angiotensin receptors on T lymphocytes to limit target organ damage in hypertension

Affiliations

A novel role for type 1 angiotensin receptors on T lymphocytes to limit target organ damage in hypertension

Jian-dong Zhang et al. Circ Res. .

Abstract

Rationale: Human clinical trials using type 1 angiotensin (AT(1)) receptor antagonists indicate that angiotensin II is a critical mediator of cardiovascular and renal disease. However, recent studies have suggested that individual tissue pools of AT(1) receptors may have divergent effects on target organ damage in hypertension.

Objective: We examined the role of AT(1) receptors on T lymphocytes in the pathogenesis of hypertension and its complications.

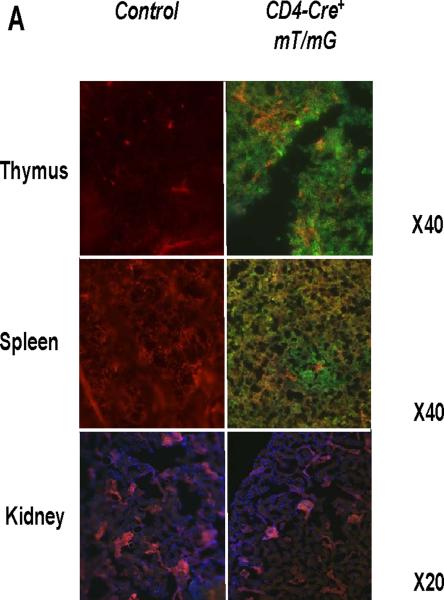
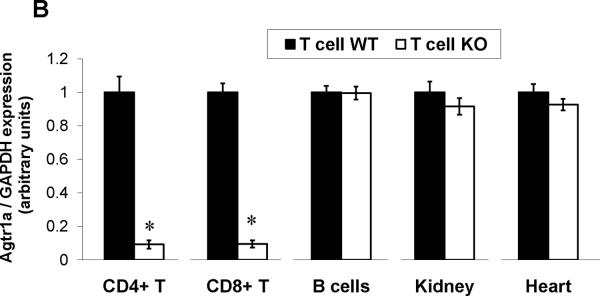
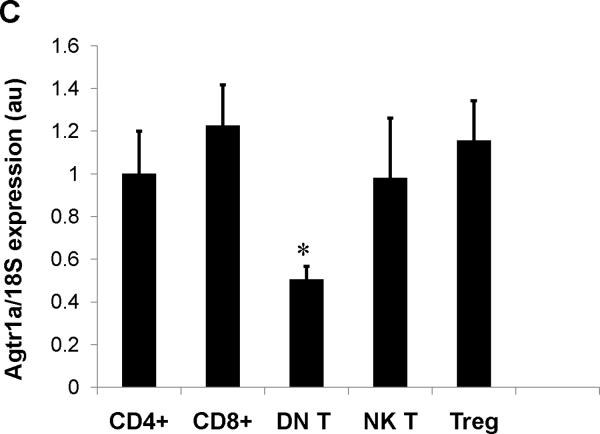
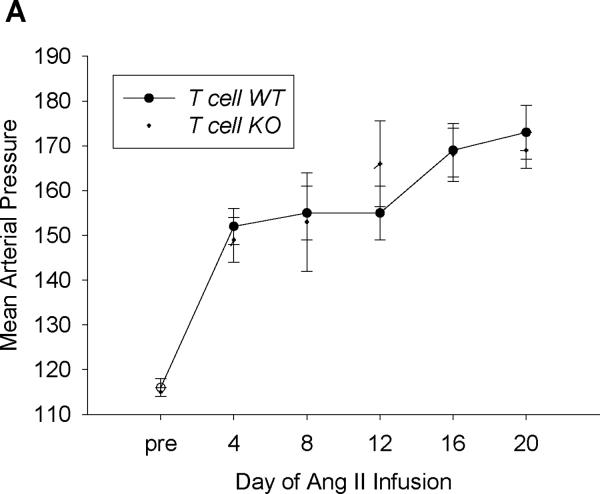
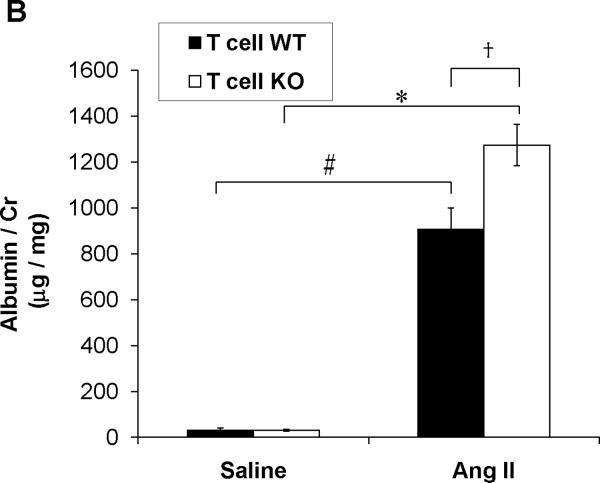
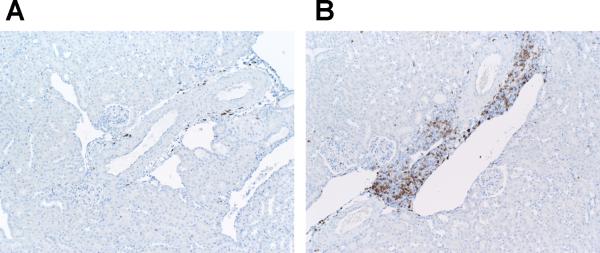
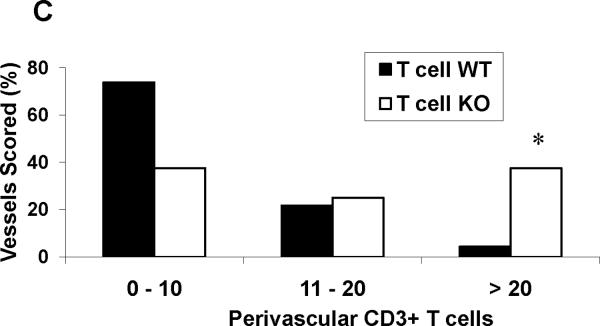
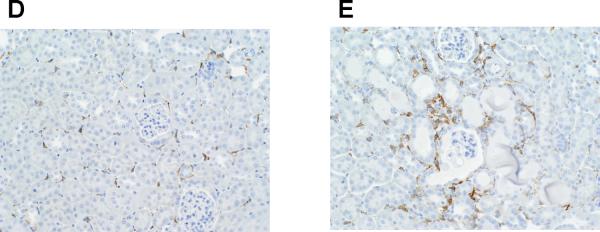
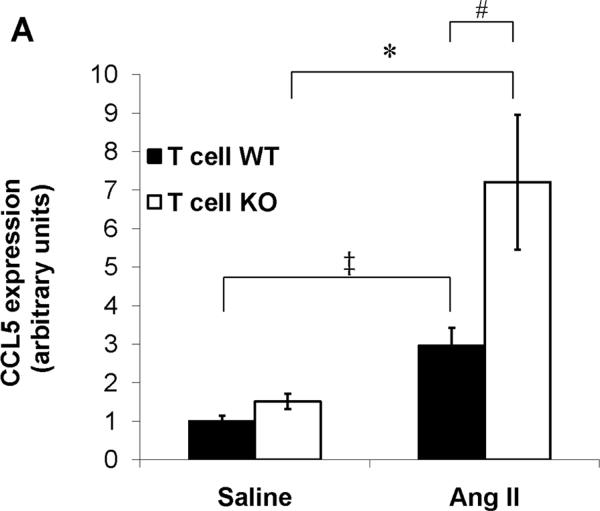
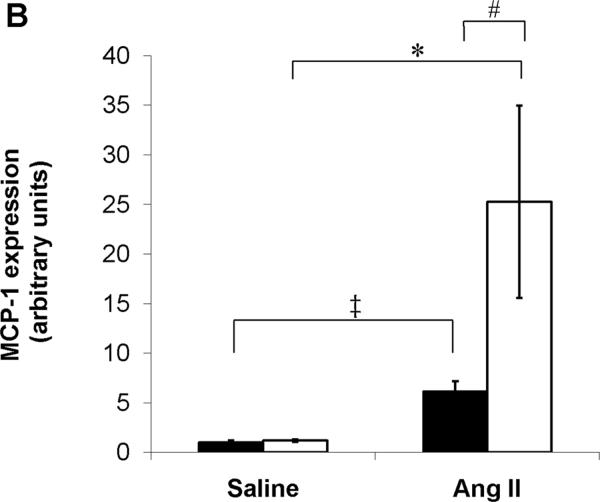
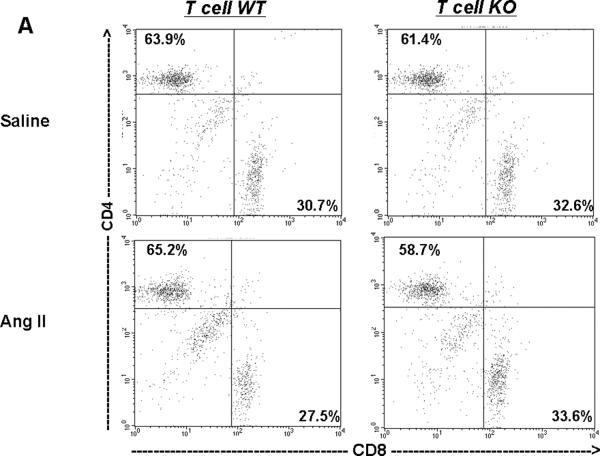
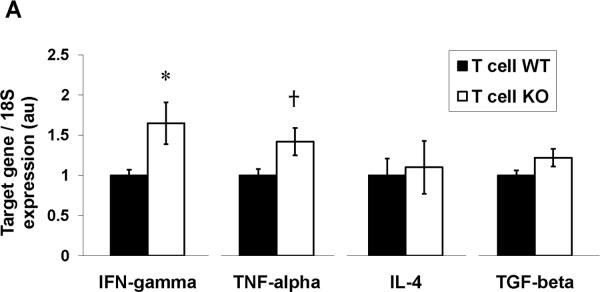
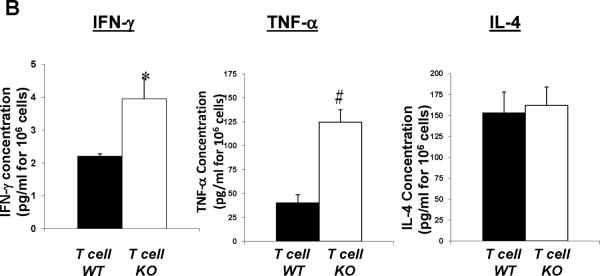
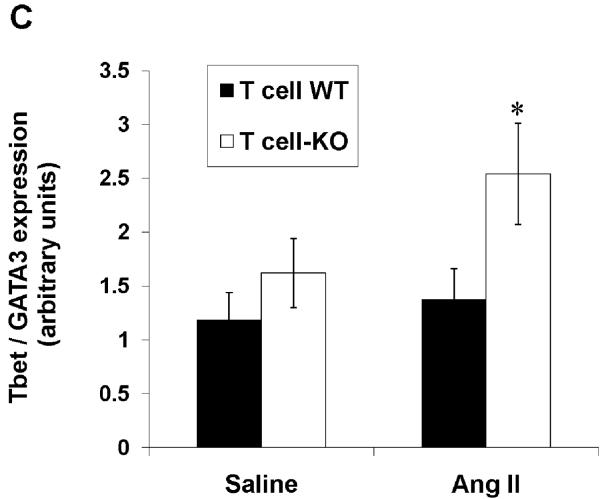
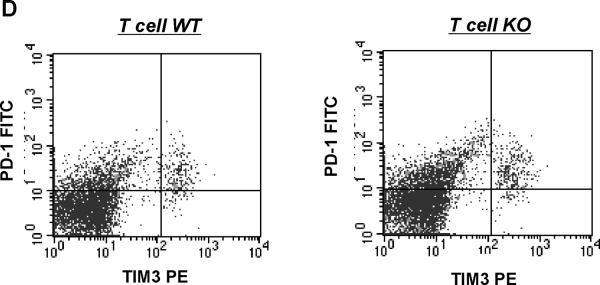
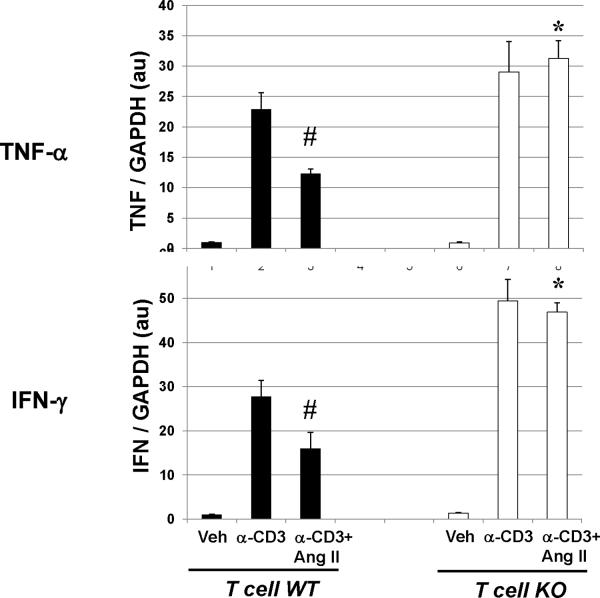
Methods and results: Deficiency of AT(1) receptors on T cells potentiated kidney injury during hypertension with exaggerated renal expression of chemokines and enhanced accumulation of T cells in the kidney. Kidneys and purified CD4(+) T cells from "T cell knockout" mice lacking AT(1) receptors on T lymphocytes had augmented expression of Th1-associated cytokines including interferon-γ and tumor necrosis factor-α. Within T lymphocytes, the transcription factors T-bet and GATA-3 promote differentiation toward the Th1 and Th2 lineages, respectively, and AT(1) receptor-deficient CD4(+) T cells had enhanced T-bet/GATA-3 expression ratios favoring induction of the Th1 response. Inversely, mice that were unable to mount a Th1 response due to T-bet deficiency were protected from kidney injury in our hypertension model.

Conclusions: The current studies identify an unexpected role for AT(1) receptors on T lymphocytes to protect the kidney in the setting of hypertension by favorably modulating CD4(+) T helper cell differentiation.


Figures

Figure 1
Figure 1. Verification of T cell-specific deletion of the AT1A receptor in T cell KO mice
A, Representative histology of thymus, spleen, and kidney in CD4-Cre+ mT/mG and Control (CD4 Cre- mT/mG) mice. Green fluorescence indicates the presence of CD4 Cre expression whereas red fluorescence indicates the absence of CD4 Cre expression. Blue fluorescence in kidney is a nuclear DAPI stain. B, Splenocytes were harvested from T cell WT and T cell KO littermates and sorted into 3 subpopulations. Agtr1a mRNA expression was quantitated in these purified immune cell populations and in kidney and heart from T cell WT and T cell KO groups (n≥6) and normalized to the T cell WT sample in each tissue. “CD4+ T” and “CD8+ T” refer to CD4+ and CD8+ T cells, respectively. *P<0.00001 vs. T cell WT. C, mRNA expression for AT1A receptor on T lymphocyte subsets in T cell WT mice. Agtr1a expression was similar on all T cell subsets analyzed except in double negative (DN) CD3+CD4-CD8- T cells, in which Agtr1a expression was significantly lower than in CD4+ or CD8+ T lymphocytes. Treg = CD4+CD25+ T regulatory cells. *P=0.04 vs. CD4+ T cells, P=0.005 vs. CD8+ T cells. N=6 per group.
Figure 2
Figure 2. Activation of AT1A receptors on T lymphocytes protects from hypertensive kidney injury
A, Baseline blood pressures were measured by radiotelemetry for 3 days. Then experimental mice were infused for 28 days with angiotensin II (1000ng/kg/min) via subcutaneously implanted osmotic minipump. Mean arterial pressures are depicted for T cell WT (n=11) and T cell KO (n=12) littermates. B, Urine samples were collected by placing experimental mice into metabolic cages after 25 days of saline or Ang II infusion. Urinary albumin excretion was quantitated per methods. #P<0.001 vs. Saline T cell WT; *P<0.0001 vs. Saline T cell KO; P<0.009 vs. Ang II T cell WT. C-E, Staining of glomerular podocytes with WT1 antibody following 4 weeks of Ang II. Podocytes stain bright green. Representative images of (C) T cell WT and (D) T cell KO glomeruli. (Magnification 40×) E, number of podocytes per glomerulus in T cell WT and KO kidneys (6 mice per group). *P=0.02 vs. T cell WT. F, Renal NGAL mRNA expression in saline- or Ang II-infused T cell WT or T cell KO mice. #P<0.02 vs. Saline T cell WT; *P=0.005 vs. Saline T cell KO; P=0.001 vs. Ang II T cell WT.
Figure 3
Figure 3. Role of the AT1A receptor on T cells in regulating infiltration of mononuclear cells into the kidney during Ang II-dependent hypertension
Embedded kidney sections were obtained from Ang II-infused T cell WT and KO mice and stained with anti-CD3 or anti-F4/80 antibody. A–B, representative images of T lymphocyte staining in kidneys from Ang II-infused (A) T cell WT mice and (B) T cell KO mice. C, proportion of renal vessels from Ang II-infused T cell WT and KO groups surrounded by 0–10, 11–20, or >20 CD3+ T cells, respectively. *P<0.0001 vs. T cell WT (Fisher's exact test across all 3 tertiles). D–E, representative images of macrophage staining in kidneys from Ang II-infused (D) T cell WT and (E) T cell KO mice.
Figure 4
Figure 4. Deficiency of AT1A receptors on T lymphocytes permits enhanced renal expression of chemokines and inflammatory cytokines in Ang II-dependent hypertension
A–B, Expression of chemokines in kidney tissues from saline- or Ang II-infused T cell WT and KO mice. A, CCL5 (RANTES) mRNA expression. P<0.02 vs. Saline T cell WT; *P<0.05 vs. Saline T cell KO; #P=0.03 vs. Ang II T cell WT. B, MCP-1 mRNA expression. P=0.009 vs. Saline T cell WT; *P<0.009 vs. Saline T cell KO; #P<0.02 vs. Ang II T cell WT. C, Expressions of IFN-γ, TNF-α, and IL-6 mRNA in kidneys from Ang II infused-T cell WT and KO mice. *P=0.04 vs. T cell WT; P<0.04 vs. T cell WT.
Figure 5
Figure 5. T cell KO mice have normal maturation of T lymphocytes in the thymus
Thymocytes were isolated from T cell WT and KO animals and labeled for CD4 and CD8. A, Representative dot-plots of single positive CD4+, CD8+, double positive, and double negative T cell proportions in thymus from T cell WT and KO animals. (n=4). B, Summary data for thymocyte proportions showing similar percentages of CD4+, CD8+, DP (CD4+CD8+), and DN (CD4CD8) thymocytes in T cell WT and KO animals.
Figure 6
Figure 6. T cell KO mice have diminished proportions of CD4+ T lymphocytes residing in spleen during Ang II-dependent hypertension
T cell proportions in spleen from saline- and Ang II-infused T cell WT and KO mice (n≥6). A, Representative dot plots of CD4+ and CD8+ T cell subsets in spleen following Saline or Ang II infusion in T cell WT and KO groups. B, Summary data for CD3+ splenocyte distribution showing diminished proportions of CD4+ T cells with a reciprocal increase in CD8+ T cell proportions in the spleens of T cell KO animals following Ang II infusion. *P<0.006 vs. Ang II T cell WT; P<0.03 vs. Ang II T cell WT.
Figure 7
Figure 7. Stimulation of the AT1A receptor on T lymphocytes constrains Th1 differentiation in the setting of hypertension
CD4+ T cells were isolated via fluorescent cell sorting from the spleens of Ang II-infused T cell WT and KO animals and characterized for Th1 vs. Th2 phenotype. A, mRNA expressions of IFN-γ, TNF-α, IL-4, and TGF-β in CD4+ T lymphocytes from T cell WT and KO mice (n≥6). *P<0.03 vs. T cell WT; P=0.03 vs. T cell WT. B, concentrations of IFN-γ, TNF-α, and IL-4 proteins in supernatants of activated splenic lymphocytes from Ang II-infused T cell WT and KO mice (n=6). *P=0.05 vs. T cell WT; #P<0.005 vs. T cell WT. C, ratio of mRNA expression of T-bet/GATA3 in purified CD4+ T lymphocytes from T cell WT and KO mice (n=5–6). *P=0.05 vs. Ang II T cell WT. D, co-expression of PD-1 and TIM-3 measured by flow cytometry is similar on splenic CD4+ T cells from T cell WT and KO mice (n≥6). Representative dotplots are shown. Summary data are presented in the text.
Figure 8
Figure 8. Chronic stimulation of AT1 receptors on T cells suppresses Th1 response in vitro
mRNA expressions of IFN-γ and TNF-α in T cell WT and KO lymphocytes subjected to 7 days of persistent T cell receptor stimulation with anti-CD3 +/− Ang II in in vitro culture. “Veh” = vehicle. #P≤0.02 vs. T cell WT+anti-CD3; *P≤0.003 vs. T cell WT+anti-CD3+AngII.

Comment in

References

    1. Lewington S, Clarke R, Qizilbash N, Peto R, Collins R. Age-specific relevance of usual blood pressure to vascular mortality: A meta-analysis of individual data for one million adults in 61 prospective studies. Lancet. 2002;360:1903–1913. - PubMed
    1. Dahlof B, Devereux RB, Kjeldsen SE, Julius S, Beevers G, de Faire U, Fyhrquist F, Ibsen H, Kristiansson K, Lederballe-Pedersen O, Lindholm LH, Nieminen MS, Omvik P, Oparil S, Wedel H. Cardiovascular morbidity and mortality in the losartan intervention for endpoint reduction in hypertension study (life): A randomised trial against atenolol. Lancet. 2002;359:995–1003. - PubMed
    1. Brenner BM, Cooper ME, de Zeeuw D, Keane WF, Mitch WE, Parving HH, Remuzzi G, Snapinn SM, Zhang Z, Shahinfar S. Effects of losartan on renal and cardiovascular outcomes in patients with type 2 diabetes and nephropathy. N Engl J Med. 2001;345:861–869. - PubMed
    1. Muller DN, Shagdarsuren E, Park JK, Dechend R, Mervaala E, Hampich F, Fiebeler A, Ju X, Finckenberg P, Theuer J, Viedt C, Kreuzer J, Heidecke H, Haller H, Zenke M, Luft FC. Immunosuppressive treatment protects against angiotensin ii-induced renal damage. Am J Pathol. 2002;161:1679–1693. - PMC - PubMed
    1. Guzik TJ, Hoch NE, Brown KA, McCann LA, Rahman A, Dikalov S, Goronzy J, Weyand C, Harrison DG. Role of the t cell in the genesis of angiotensin ii induced hypertension and vascular dysfunction. J Exp Med. 2007;204:2449–2460. - PMC - PubMed

Publication types

Substances