Genome-wide DNA methylation analysis reveals novel epigenetic changes in chronic lymphocytic leukemia
- PMID: 22534504
- PMCID: PMC3398986
- DOI: 10.4161/epi.20237
Genome-wide DNA methylation analysis reveals novel epigenetic changes in chronic lymphocytic leukemia
Abstract
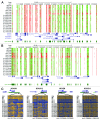
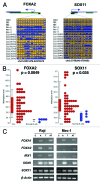
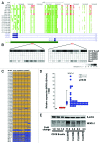
We conducted a genome-wide DNA methylation analysis in CD19 (+) B-cells from chronic lymphocytic leukemia (CLL) patients and normal control samples using reduced representation bisulfite sequencing (RRBS). The methylation status of 1.8-2.3 million CpGs in the CLL genome was determined; about 45% of these CpGs were located in more than 23,000 CpG islands (CGIs). While global CpG methylation was similar between CLL and normal B-cells, 1764 gene promoters were identified as being differentially methylated in at least one CLL sample when compared with normal B-cell samples. Nineteen percent of the differentially methylated genes were involved in transcriptional regulation. Aberrant hypermethylation was found in all HOX gene clusters and a significant number of WNT signaling pathway genes. Hypomethylation occurred more frequently in the gene body including introns, exons, and 3'-UTRs in CLL. The NFATc1 P2 promoter and first intron was found to be hypomethylated and correlated with upregulation of both NFATc1 RNA and protein expression levels in CLL suggesting that an epigenetic mechanism is involved in the constitutive activation of NFAT activity in CLL cells. This comprehensive DNA methylation analysis will further our understanding of the epigenetic contribution to cellular dysfunction in CLL.
Figures


Similar articles
-
Global DNA methylation profiling reveals new insights into epigenetically deregulated protein coding and long noncoding RNAs in CLL.Clin Epigenetics. 2016 Oct 12;8:106. doi: 10.1186/s13148-016-0274-6. eCollection 2016. Clin Epigenetics. 2016. PMID: 27777635 Free PMC article.
-
Hypomethylation coordinates antagonistically with hypermethylation in cancer development: a case study of leukemia.Hum Genomics. 2016 Jul 25;10 Suppl 2(Suppl 2):18. doi: 10.1186/s40246-016-0071-5. Hum Genomics. 2016. PMID: 27461342 Free PMC article.
-
Uncovering the DNA methylome in chronic lymphocytic leukemia.Epigenetics. 2013 Feb;8(2):138-48. doi: 10.4161/epi.23439. Epub 2013 Jan 15. Epigenetics. 2013. PMID: 23321535 Free PMC article. Review.
-
Expression analysis of the epigenetic methyltransferases and methyl-CpG binding protein families in the normal B-cell and B-cell chronic lymphocytic leukemia (CLL).Cancer Biol Ther. 2004 Oct;3(10):989-94. doi: 10.4161/cbt.3.10.1137. Epub 2004 Oct 2. Cancer Biol Ther. 2004. PMID: 15467427
-
Epigenetic deregulation in chronic lymphocytic leukemia: Clinical and biological impact.Semin Cancer Biol. 2018 Aug;51:1-11. doi: 10.1016/j.semcancer.2018.02.001. Epub 2018 Feb 7. Semin Cancer Biol. 2018. PMID: 29427646 Review.
Cited by
-
Flow-Dependent Epigenetic DNA Methylation in Endothelial Gene Expression and Atherosclerosis.Arterioscler Thromb Vasc Biol. 2015 Jul;35(7):1562-9. doi: 10.1161/ATVBAHA.115.305042. Epub 2015 May 7. Arterioscler Thromb Vasc Biol. 2015. PMID: 25953647 Free PMC article. Review.
-
RPPA-based protein profiling reveals eIF4G overexpression and 4E-BP1 serine 65 phosphorylation as molecular events that correspond with a pro-survival phenotype in chronic lymphocytic leukemia.Oncotarget. 2015 Jun 10;6(16):14632-45. doi: 10.18632/oncotarget.4104. Oncotarget. 2015. PMID: 25999352 Free PMC article.
-
Targeting DNA Methylation in Leukemia, Myelodysplastic Syndrome, and Lymphoma: A Potential Diagnostic, Prognostic, and Therapeutic Tool.Int J Mol Sci. 2022 Dec 30;24(1):633. doi: 10.3390/ijms24010633. Int J Mol Sci. 2022. PMID: 36614080 Free PMC article. Review.
-
Genome-Wide Methylation Profiling in Canine Mammary Tumor Reveals miRNA Candidates Associated with Human Breast Cancer.Cancers (Basel). 2019 Sep 29;11(10):1466. doi: 10.3390/cancers11101466. Cancers (Basel). 2019. PMID: 31569550 Free PMC article.
-
Alterations in DNA methylation/demethylation intermediates predict clinical outcome in chronic lymphocytic leukemia.Oncotarget. 2017 Aug 9;8(39):65699-65716. doi: 10.18632/oncotarget.20081. eCollection 2017 Sep 12. Oncotarget. 2017. PMID: 29029465 Free PMC article.
References
Publication types
MeSH terms
Substances
Grants and funding
LinkOut - more resources
Full Text Sources
Other Literature Sources
Molecular Biology Databases
Miscellaneous
