Meta-Analysis
. 2012 May 16;104(10):740-8.
doi: 10.1093/jnci/djs191. Epub 2012 Apr 25.

Association between genetic variants on chromosome 15q25 locus and objective measures of tobacco exposure

Affiliations
Meta-Analysis

Association between genetic variants on chromosome 15q25 locus and objective measures of tobacco exposure

Marcus R Munafò et al. J Natl Cancer Inst. .

Abstract

Background: Two single-nucleotide polymorphisms, rs1051730 and rs16969968, located within the nicotinic acetylcholine receptor gene cluster on chromosome 15q25 locus, are associated with heaviness of smoking, risk for lung cancer, and other smoking-related health outcomes. Previous studies have typically relied on self-reported smoking behavior, which may not fully capture interindividual variation in tobacco exposure.

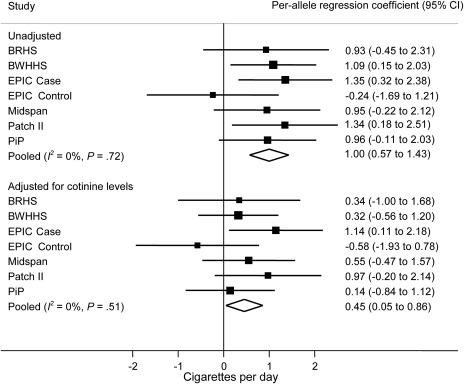
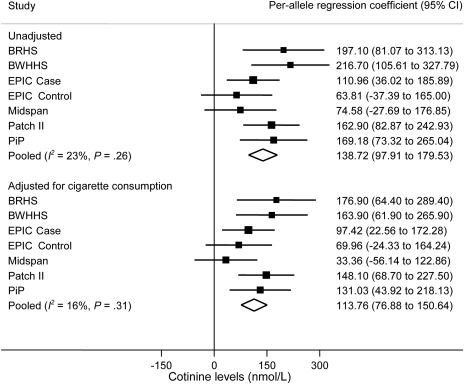
Methods: We investigated the association of rs1051730 and rs16969968 genotype (referred to as rs1051730-rs16969968, because these are in perfect linkage disequilibrium and interchangeable) with both self-reported daily cigarette consumption and biochemically measured plasma or serum cotinine levels among cigarette smokers. Summary estimates and descriptive statistical data for 12 364 subjects were obtained from six independent studies, and 2932 smokers were included in the analyses. Linear regression was used to calculate the per-allele association of rs1051730-rs16969968 genotype with cigarette consumption and cotinine levels in current smokers for each study. Meta-analysis of per-allele associations was conducted using a random effects method. The likely resulting association between genotype and lung cancer risk was assessed using published data on the association between cotinine levels and lung cancer risk. All statistical tests were two-sided.

Results: Pooled per-allele associations showed that current smokers with one or two copies of the rs1051730-rs16969968 risk allele had increased self-reported cigarette consumption (mean increase in unadjusted number of cigarettes per day per allele = 1.0 cigarette, 95% confidence interval [CI] = 0.57 to 1.43 cigarettes, P = 5.22 × 10(-6)) and cotinine levels (mean increase in unadjusted cotinine levels per allele = 138.72 nmol/L, 95% CI = 97.91 to 179.53 nmol/L, P = 2.71 × 10(-11)). The increase in cotinine levels indicated an increased risk of lung cancer with each additional copy of the rs1051730-rs16969968 risk allele (per-allele odds ratio = 1.31, 95% CI = 1.21 to 1.42).

Conclusions: Our data show a stronger association of rs1051730-rs16969968 genotype with objective measures of tobacco exposure compared with self-reported cigarette consumption. The association of these variants with lung cancer risk is likely to be mediated largely, if not wholly, via tobacco exposure.


Figures

Figure 1
Figure 1
Meta-analysis of association of rs1051730–rs16969968 risk allele with cigarette consumption in current smokers. Data from six independent studies contributed to the meta-analysis. Cotinine levels and self-reported cigarette consumption differed in current smoker case subjects (EPIC Case) and control subjects (EPIC Control) in the EPIC study, so they were analyzed separately. In each study, linear regression was used to calculate per-allele association of rs1051730–rs16969968 genotype with daily cigarette consumption. Units represent cigarettes per day. Unadjusted and adjusted (for cotinine levels) analyses are shown. The I2 statistic was used to estimate the percentage of total variation in study estimates resulting from between-study heterogeneity. Individual study regression coefficients were combined using random effects methods. Squares represent per-allele regression coefficients, which represent mean increase in number of cigarettes per day per allele; size of the square represents inverse of the variance of the regression coefficient; horizontal lines represent 95% CIs; diamonds represent summary estimate combining the study-specific estimates using a random effects model; solid vertical line represents a regression coefficient of 0. P for heterogeneity was derived from the Cochran Q test (one-sided). All other statistical tests were two-sided, and statistical significance required a P value of .05 or less. BRHS = British Regional Heart Study; BWHHS = British Women’s Heart and Health Study; CI = confidence interval; EPIC = European Prospective Investigation into Cancer and Nutrition; PiP = Patch in Practice.
Figure 2
Figure 2
Meta-analysis of association of rs1051730–rs16969968 risk allele with cotinine levels in current smokers. Data from six independent studies contributed to the meta-analysis. Cotinine levels and self-reported cigarette consumption differed in current smoker case subjects (EPIC Case) and control subjects (EPIC Control) in the EPIC study, so they were analyzed separately. In each study, linear regression was used to calculate per-allele association of rs1051730–rs16969968 genotype with cotinine levels. Units represent nmol/L. Unadjusted and adjusted (for cigarette consumption) analyses are shown. The I2 statistic was used to estimate the percentage of total variation in study estimates resulting from between-study heterogeneity. Individual study regression coefficients were combined using random effects methods. Squares represent per allele regression coefficient, which represents mean increase in cotinine levels per allele; size of the square represents inverse of the variance of the regression coefficient; horizontal lines represent 95% CIs; diamonds represent summary estimate combining the study-specific estimates with a random effects model; solid vertical line represents a regression coefficient of 0. P for heterogeneity was derived from the Cochran Q test (one-sided). All other statistical tests were two-sided, and statistical significance required a P value of .05 or less. BRHS = British Regional Heart Study; BWHHS = British Women’s Heart and Health Study; CI = confidence interval; EPIC = European Prospective Investigation into Cancer and Nutrition; PiP = Patch in Practice.

Comment in

  • Cotinine conundrum--a step forward but questions remain.
    Spitz MR, Amos CI, Bierut LJ, Caporaso NE. Spitz MR, et al. J Natl Cancer Inst. 2012 May 16;104(10):720-2. doi: 10.1093/jnci/djs211. Epub 2012 Apr 25. J Natl Cancer Inst. 2012. PMID: 22534783 Free PMC article. No abstract available.

References

    1. Amos CI, Wu XF, Broderick P, et al. Genome-wide association scan of tag SNPs identifies a susceptibility locus for lung cancer at 15q25.1. Nat Genet. 2008;40(5):616–622. - PMC - PubMed
    1. Hung RJ, Mckay JD, Gaborieau V, et al. A susceptibility locus for lung cancer maps to nicotinic acetylcholine receptor subunit genes on 15q25. Nature. 2008;452(7187):633–637. - PubMed
    1. Thorgeirsson TE, Geller F, Sulem P, et al. A variant associated with nicotine dependence, lung cancer and peripheral arterial disease. Nature. 2008;452(7187):638–639. - PMC - PubMed
    1. Pillai SG, Ge DL, Zhu GH, et al. A genome-wide association study in chronic obstructive pulmonary disease (COPD): identification of two major susceptibility loci. PloS Genet. 2009;5(3):e1000421. - PMC - PubMed
    1. Young RP, Hophins RJ, Hay BA, Epton MJ, Black PN, Gamble GD. Lung cancer gene associated with COPD: triple whammy or possible confounding effect? Eur Resp J. 2008;32(5):1158–1164. - PubMed

Publication types