. 2012 Dec;61(12):1701-7.
doi: 10.1136/gutjnl-2011-301689. Epub 2012 Apr 25.

Gut-derived lipopolysaccharide augments adipose macrophage accumulation but is not essential for impaired glucose or insulin tolerance in mice

Affiliations
Free PMC article

Gut-derived lipopolysaccharide augments adipose macrophage accumulation but is not essential for impaired glucose or insulin tolerance in mice

Robert Caesar et al. Gut. 2012 Dec.
Free PMC article

Abstract

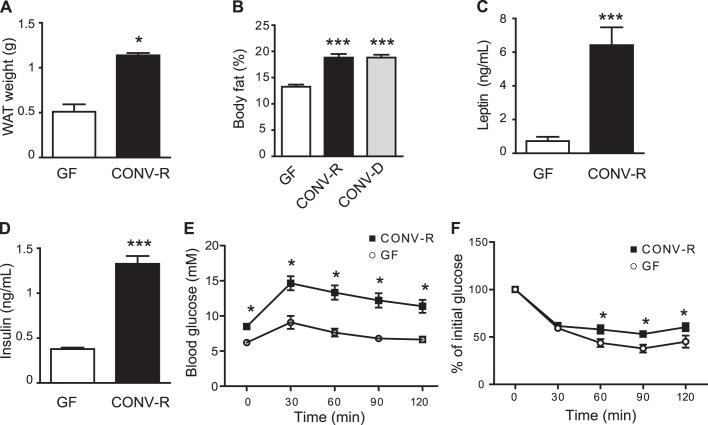
Background: Obesity is associated with accumulation of macrophages in white adipose tissue (WAT), which contribute to the development of insulin resistance. Germ-free (GF) mice have reduced adiposity and are protected against diet-induced obesity,

Objective: To investigate whether the gut microbiota and, specifically, gut-derived lipopolysaccharide (LPS) promote WAT inflammation and contribute to impaired glucose metabolism.

Method: Macrophage composition and expression of proinflammatory and anti-inflammatory markers were compared in WAT of GF, conventionally raised and Escherichia coli-monocolonised mice. Additionally, glucose and insulin tolerance in these mice was determined.

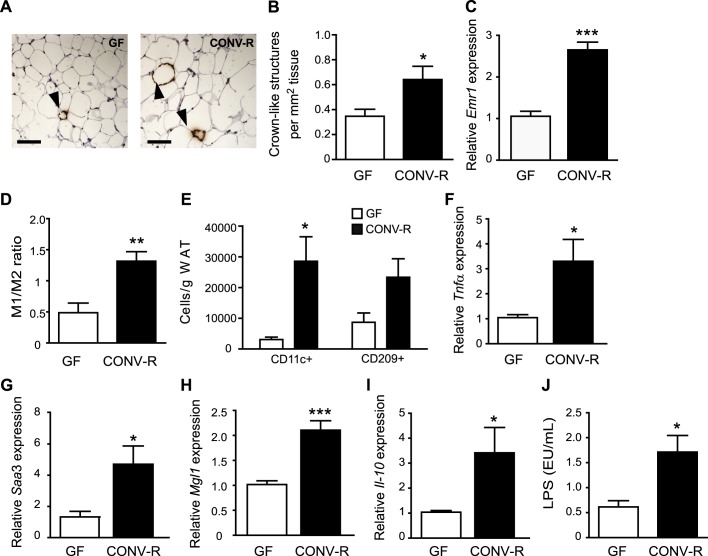
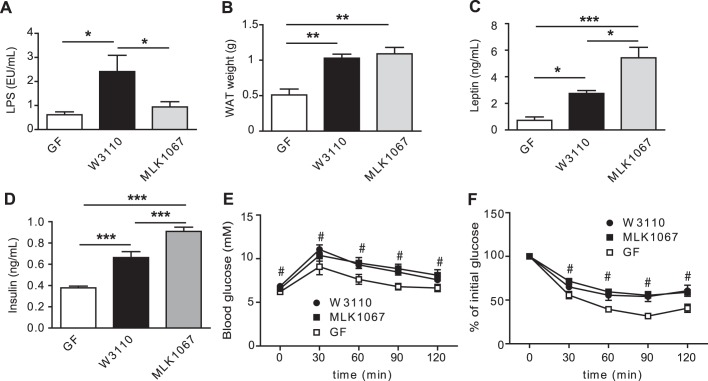
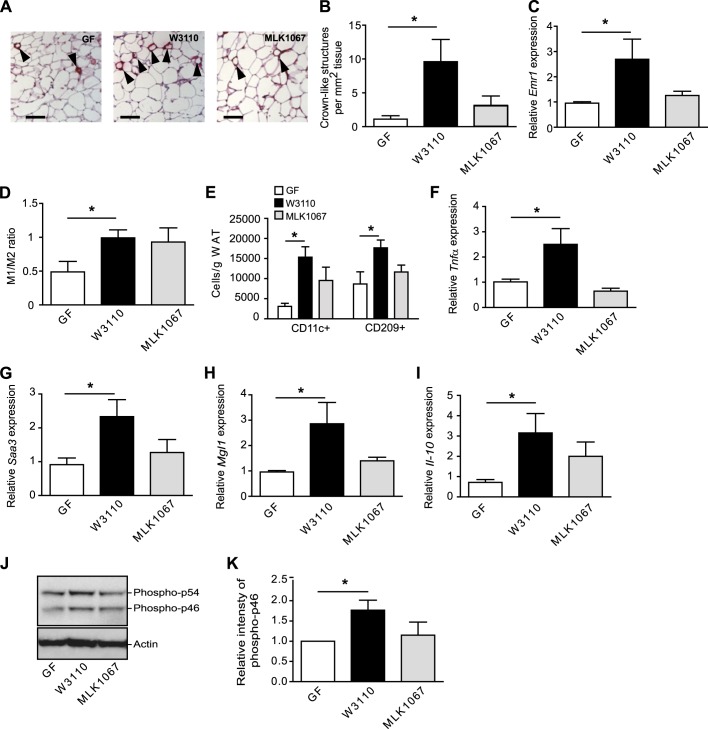
Results: The presence of a gut microbiota resulted in impaired glucose metabolism and increased macrophage accumulation and polarisation towards the proinflammatory M1 phenotype in WAT. Monocolonisation of GF mice for 4 weeks with E. coli W3110 or the isogenic strain MLK1067 (which expresses LPS with reduced immunogenicity) resulted in impaired glucose and insulin tolerance and promoted M1 polarisation of CD11b cells in WAT. However, colonisation with E. coli W3110 but not MLK1067 promoted macrophage accumulation and upregulation of proinflammatory and anti-inflammatory gene expression as well as JNK phosphorylation.

Conclusion: Gut microbiota induced LPS-dependent macrophage accumulation in WAT, whereas impairment of systemic glucose metabolism was not dependent on LPS. These results indicate that macrophage accumulation in WAT does not always correlate with impaired glucose metabolism.


Conflict of interest statement

Competing interests: None.

Figures

Figure 1
Figure 1
Gut microbiota increases adipose tissue weight and impairs glucose homoeostasis. (A) Epididymal white adipose tissue (WAT) weight in germ-free (GF) and conventionally raised (CONV-R) mice (n=8–9 mice per group). (B) Body fat determined by DEXA in GF and CONV-R mice and in GF mice colonised with a normal microbiota for 14 days (CONV-D) (n=8–10 mice per group). (C) Fasting plasma leptin and (D) insulin levels in GF and CONV-R mice (n=7–8 mice per group). (E) Glucose (n=8–9 mice per group) and (F) insulin tolerance in GF and CONV-R mice (n=5–6 mice per group). Mean values ± SEM are plotted; *p<0.05, ***p<0.001 versus GF.
Figure 2
Figure 2
Gut microbiota increases crown-like structure (CLS) formation, M1/M2 ratio and expression of proinflammatory and anti-inflammatory cytokines in white adipose tissue (WAT). (A) Representative MAC-2 immunostaining of WAT from germ-free (GF) and conventionally raised (CONV-R) mice. Arrowheads indicate CLS. Scale bars = 100 μm. (B) Quantification of CLS (n=9 mice per group). (C) qRT-PCR analysis of Emr1 expression in WAT from GF and CONV-R mice (n=8–9 mice per group). (D) Ratio between WAT M1 and M2 macrophages determined by flow cytometry with antibodies against CD11c conjugated with phycoerythrin and CD209 conjugated antigen presenting cells, respectively (n=4 (GF) and 8 (CONV-R)). (E) Number of CD11c (M1) and CD209 (M2) macrophages per gram WAT (n=4). (F–I) qRT-PCR analysis of Tnfα, Saa3, Mgl1 and Il-10 expression in WAT from GF and CONV-R mice (n=8–9 mice per group). (J) Lipopolysaccharide (LPS) levels in blood sampled from the portal vein of GF (n=9) and CONV-R (n=15) mice. Mean values ± SEM are plotted; *p<0.05, **p<0.01, ***p<0.001 versus GF.
Figure 3
Figure 3
E.coli colonisation of germ-free (GF) mice increases white adipose tissue (WAT) weight and impairs glucose and insulin tolerance. (A) Lipopolysaccharide (LPS) levels in blood sampled from the portal vein of GF mice and mice colonised for 4 weeks with W3110 or MLK1067 (n=5-6 mice per group). (B) Epididymal WAT weight (n=9–10 mice per group). (C) Fasting plasma leptin and (D) insulin levels in GF and conventionally raised (CONV-R) mice (n=9–10 mice per group). (E) Glucose tolerance test (n=9–10 mice per group). (F) Insulin tolerance test (n=5–6 mice per group). Mean values ± SEM are plotted; *p<0.05; **p< 0.01; ***p< 0.001 versus GF in A–D; #p<0.05 vs GF for both W3110 and MLK1067 in panels E and F.
Figure 4
Figure 4
Gut-derived lipopolysaccharide (LPS) increases crown-like structure (CLS) formation, M1/M2 ratio and expression of proinflammatory and anti-inflammatory cytokines in white adipose tissue (WAT). (A) Representative immunostaining of MAC-2 in WAT from germ-free (GF) mice and mice colonised for 4 weeks with W3110 or MLK1067. Arrowheads indicate CLS. Scale bars = 100 μm. (B) Quantification of CLS (n=4–5 mice per group). (C) qRT-PCR analysis of Emr1 (F4/80) in WAT (n=6–7 mice per group). (D) Ratio between M1 and M2 activated macrophages in WAT determined by flow cytometry with antibodies against CD11c and CD209 conjugated (n=4 (GF) and 9 (W3110 and MLK1067)). (E) Number of CD11c+ (M1) and CD209 (M2) macrophages per gram WAT (n=4–5). (F–I) qRT-PCR analysis of Tnfα, Saa3, Mgl1 and Il-10 expression in WAT (n=5–6 mice per group). (J) Total protein extracts from WAT were analysed by immunoblotting with antibodies against phospho-JNK and actin. (K) Relative quantification of the phospho-p46 form of JNK normalised to actin (n=6 mice per group). Mean values ± SEM are plotted; *p<0.05.

Comment in

  • Microbes and metabolic health.
    Shanahan F. Shanahan F. Gut. 2012 Dec;61(12):1655-6. doi: 10.1136/gutjnl-2012-302507. Epub 2012 May 25. Gut. 2012. PMID: 22637700 No abstract available.

References

    1. Weisberg SP, McCann D, Desai M, et al. Obesity is associated with macrophage accumulation in adipose tissue. J Clin Invest 2003;112:1796–808 - PMC - PubMed
    1. Xu H, Barnes GT, Yang Q, et al. Chronic inflammation in fat plays a crucial role in the development of obesity-related insulin resistance. J Clin Invest 2003;112:1821–30 - PMC - PubMed
    1. Lumeng CN, Bodzin JL, Saltiel AR. Obesity induces a phenotypic switch in adipose tissue macrophage polarization. J Clin Invest 2007;117:175–84 - PMC - PubMed
    1. Backhed F, Manchester JK, Semenkovich CF, et al. Mechanisms underlying the resistance to diet-induced obesity in germ-free mice. Proc Natl Acad Sci U S A 2007;104:979–84 - PMC - PubMed
    1. Rabot S, Membrez M, Bruneau A, et al. Germ-free c57bl/6j mice are resistant to high-fat-diet-induced insulin resistance and have altered cholesterol metabolism. FASEB J 2010:4948–59 - PubMed

Publication types

MeSH terms