. 2012 Jul 19;120(3):664-70.
doi: 10.1182/blood-2012-03-415323. Epub 2012 Apr 24.

Exposure of R169 controls protein C activation and autoactivation

Affiliations

Exposure of R169 controls protein C activation and autoactivation

Nicola Pozzi et al. Blood. .

Abstract

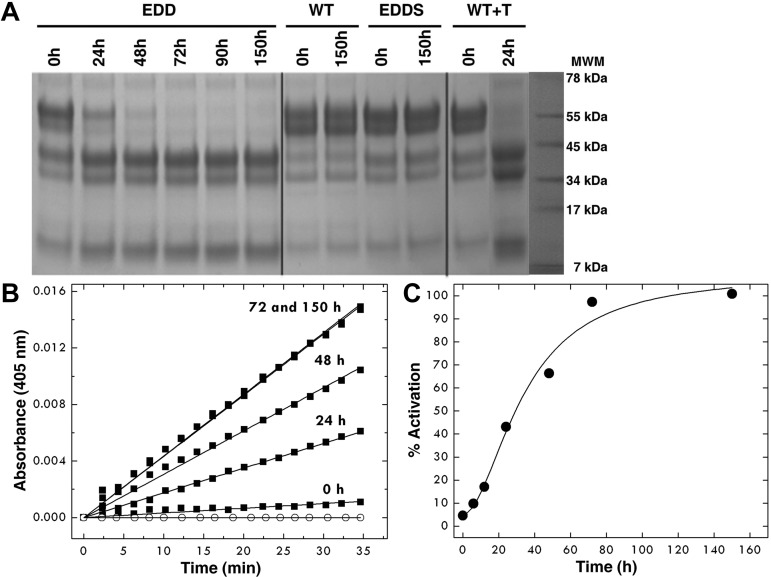
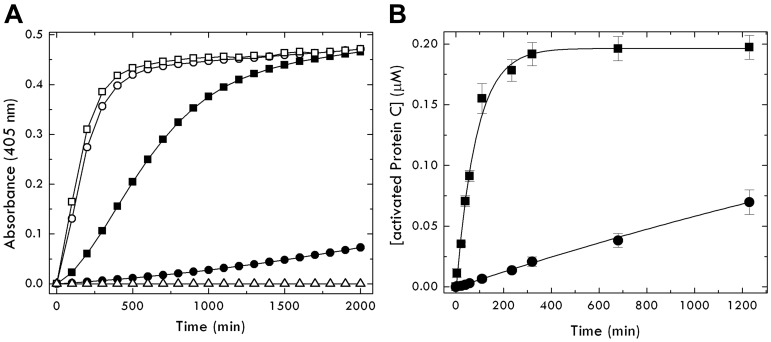
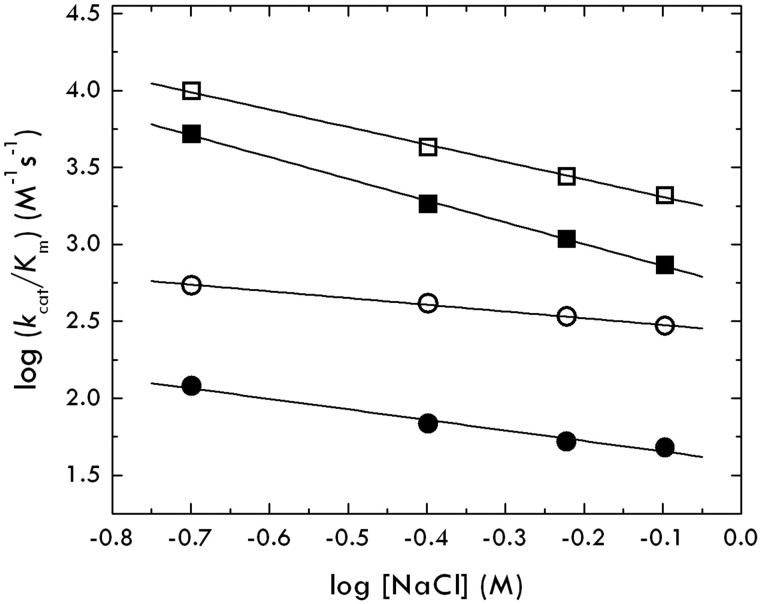
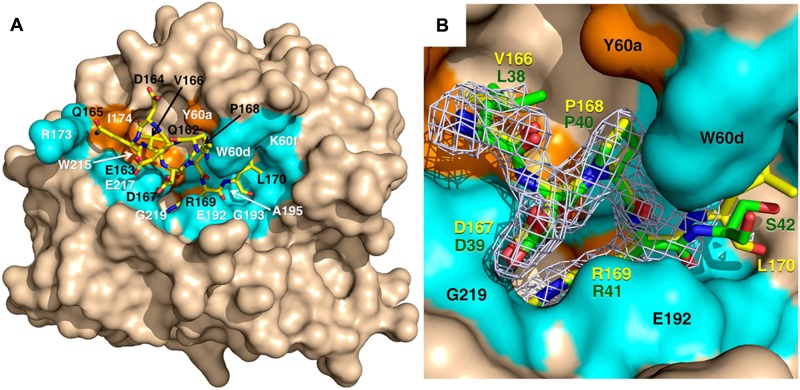
Protein C is activated by thrombin with a value of k(cat)/K(m) = 0.11mM(-1)s(-1) that increases 1700-fold in the presence of the cofactor thrombomodulin. The molecular origin of this effect triggering an important feedback loop in the coagulation cascade remains elusive. Acidic residues in the activation domain of protein C are thought to electrostatically clash with the active site of thrombin. However, functional and structural data reported here support an alternative scenario. The thrombin precursor prethrombin-2 has R15 at the site of activation in ionic interaction with E14e, D14l, and E18, instead of being exposed to solvent for proteolytic attack. Residues E160, D167, and D172 around the site of activation at R169 of protein C occupy the same positions as E14e, D14l, and E18 in prethrombin-2. Caging of R169 by E160, D167, and D172 is responsible for much of the poor activity of thrombin toward protein C. The E160A/D167A/D172A mutant is activated by thrombin 63-fold faster than wild-type in the absence of thrombomodulin and, over a slower time scale, spontaneously converts to activated protein C. These findings establish a new paradigm for cofactor-assisted reactions in the coagulation cascade.


Figures

Figure 1
Figure 1
Autoactivation of the EDD mutant of protein C. After affinity chromatography, the protein concentration was adjusted to 0.8 mg/mL and protein C was left at room temperature for 150 hours. (A) SDS-PAGE electrophoresis documents the spontaneous conversion of the EDD mutant of protein C to activated protein C with disappearance of the band at 55 kDa and thickening of the bands in the 34- to 45-kDa range. The chemical identity of the downshifted bands as the activated product was confirmed by N-terminal sequencing and mapped to the sequence LIDGK corresponding to the new N-terminus of the heavy chain of activated protein C. Double bands reflect the intrinsic heterogeneity of protein C resulting from posttranslational modifications. The profile after 72 hours becomes identical to that observed on activation of wild-type protein C with thrombin. No autoactivation is observed with wild-type protein C and the inactive mutant EDDS up to 150 hours. (B) The kinetics of autoactivation was monitored from hydrolysis of DRR, a chromogenic substrate specific for activated protein C, under experimental conditions of 5mM Tris, pH 7.4, 145mM NaCl, 2mM CaCl2, 0.1% PEG8000 at 37°C. ○ represents wild-type protein C. (C) The amount of activation of the protein C mutant EDD was monitored over time from the progress curves in panel B and converted into a percentage. The sigmoidal shape of the curve is indicative of the presence of intermediates along the autoactivation pathway, consistent with an autocatalytic process.
Figure 2
Figure 2
Activation of the EDD mutant of protein C by thrombin. (A) Shown are progress curves of DRR hydrolysis by activated protein C generated from the zymogen form (circles represent wild-type, and squares, EDD) on interaction with thrombin, in the absence (closed symbols) or presence (open symbols) of 50nM thrombomodulin, under experimental conditions of 5mM Tris, pH 7.4, 145mM NaCl, 5mM CaCl2, 0.1% PEG8000 at 37°C. Analysis of the curves gives the value of kcat/Km for activation of protein C as follows: 0.11 ± 0.01mM−1s−1 (●), 6.9 ± 0.1mM−1s−1 (■), 190 ± 10mM−1s−1 (○), and 560 ± 20mM−1s−1 (□). ▵ represents the inactive EDDS mutant of protein C as a control. The sigmoidal nature of the progress curve, most visible in the case of the EDD mutant, is the result of the continuous nature of the assay that measures hydrolysis of DRR after the buildup of activated protein C. Autoactivation of EDD is negligible under the conditions used in the assay because it evolves over a time scale that extends beyond the complete generation of activated protein C by thrombin (Figure 1). (B) Kinetics of protein C wild-type (0.2μM, ●) and mutant EDD (0.2μM, ■) activation by thrombin (30nM) under conditions of pseudo–first order kinetics ([protein C] ≪ Km). Continuous lines were drawn according to a single exponential with values of kobs/[thrombin] = kcat/Km of 0.11 ± 0.02 (wild-type) and 6.7 ± 0.3 (EDD mutant), in excellent agreement with the values determined independently from progress curves of DRR hydrolysis (see A). No lag phase is observed in this discontinuous assay because activation of protein C is determined by quenching the thrombin-catalyzed reaction at different times under pseudo–first order kinetics.
Figure 3
Figure 3
Salt dependence of the thrombin-protein C interaction. The value of kcat/Km for protein C activation by thrombin under experimental conditions of 50mM Tris, pH 7.4, 5mM CaCl2, 0.1% PEG8000 at 37°C, was measured as a function of salt concentration in the range 200 to 800mM. The slope in the log-log plot, Γ, gives a measure of the electrostatic coupling (ie, charges involved or ions exchanged) on formation of the complex. Symbols refer to protein C wild-type (circles) or mutant EDD (squares) in the presence of thrombin wild-type (closed symbols) or mutant E192Q (open symbols). Values of Γ are as follows: −0.7 ± 0.1 (closed circles, thrombin-protein C), −1.4 ± 0.1 (closed squares, thrombin-protein C EDD), −0.5 ± 0.1 (open circles, thrombin E192Q-protein C), and −1.1 ± 0.1 (open squares, thrombin E192Q-protein C EDD). These values prove that there is no electrostatic clash between thrombin and protein C. The thrombin-protein C interaction is actually favored by electrostatic coupling that increases with the EDD mutation of protein C but is not affected by the E192Q mutation of thrombin.
Figure 4
Figure 4
X-ray crystal structure of thrombin S195A in complex with a fragment of the activation domain of protein C. (A) Thrombin is rendered in surface representation (wheat) with the active site in the center and exosite I on the right. The protein C peptide is rendered in stick representation (yellow). Residues of thrombin interacting with the protein C peptide through molecular contacts within 4 Å are in orange (hydrophobic contacts) or marine (polar contacts). (B) Details of how the P4 to P1′ residues of the protein C peptide (yellow sticks) dock into the active site of thrombin. The 2Fo-Fc electron density map (light green mesh) is contoured at 1 σ. A direct comparison is shown with the P4 to P1′ residues of the thrombin receptor PAR1 (green sticks). R169 penetrates the primary specificity pocket and is partially covered in this view by the side chain of E192. P168 at the P2 position makes strong hydrophobic interactions with residues P60b, P60c, and W60d. D167 at the P3 position makes a polar interaction with the backbone N atom of G219 of thrombin, which mimics the interaction of D39 at the P3 position of PAR1. V166 at the P4 position points toward W215 in the aryl binding site. Overall, the binding mode of the P1 to P4 residues of protein C is very similar to that of the P1 to P4 residues of PAR1 and D167 at the P3 position of substrate makes favorable contribution to binding. Values of the B-factor for residues of the protein C peptide are given in parentheses (Å2): Q162 (65), E163 (65), D164 (67), Q165 (68), V166 (46), D167 (37), P168 (34), R169 (32), and L170 (57).

Comment in

References

    1. Page MJ, Di Cera E. Serine peptidases: classification, structure and function. Cell Mol Life Sci. 2008;65(7):1220–1236. - PMC - PubMed
    1. Krem MM, Di Cera E. Evolution of enzyme cascades from embryonic development to blood coagulation. Trends Biochem Sci. 2002;27(2):67–74. - PubMed
    1. Gros P, Milder FJ, Janssen BJ. Complement driven by conformational changes. Nat Rev Immunol. 2008;8(1):48–58. - PubMed
    1. Gohara DW, Di Cera E. Allostery in trypsin-like proteases suggests new therapeutic strategies. Trends Biotechnol. 2011;29(11):577–585. - PMC - PubMed
    1. Arlaud GJ, Barlow PN, Gaboriaud C, Gros P, Narayana SV. Deciphering complement mechanisms: the contributions of structural biology. Mol Immunol. 2007;44(16):3809–3822. - PubMed

Publication types