. 2012 Jun 14;119(24):5742-9.
doi: 10.1182/blood-2011-08-371245. Epub 2012 Apr 25.

The differential production of cytokines by human Langerhans cells and dermal CD14(+) DCs controls CTL priming

Affiliations

The differential production of cytokines by human Langerhans cells and dermal CD14(+) DCs controls CTL priming

Jacques Banchereau et al. Blood. .

Abstract

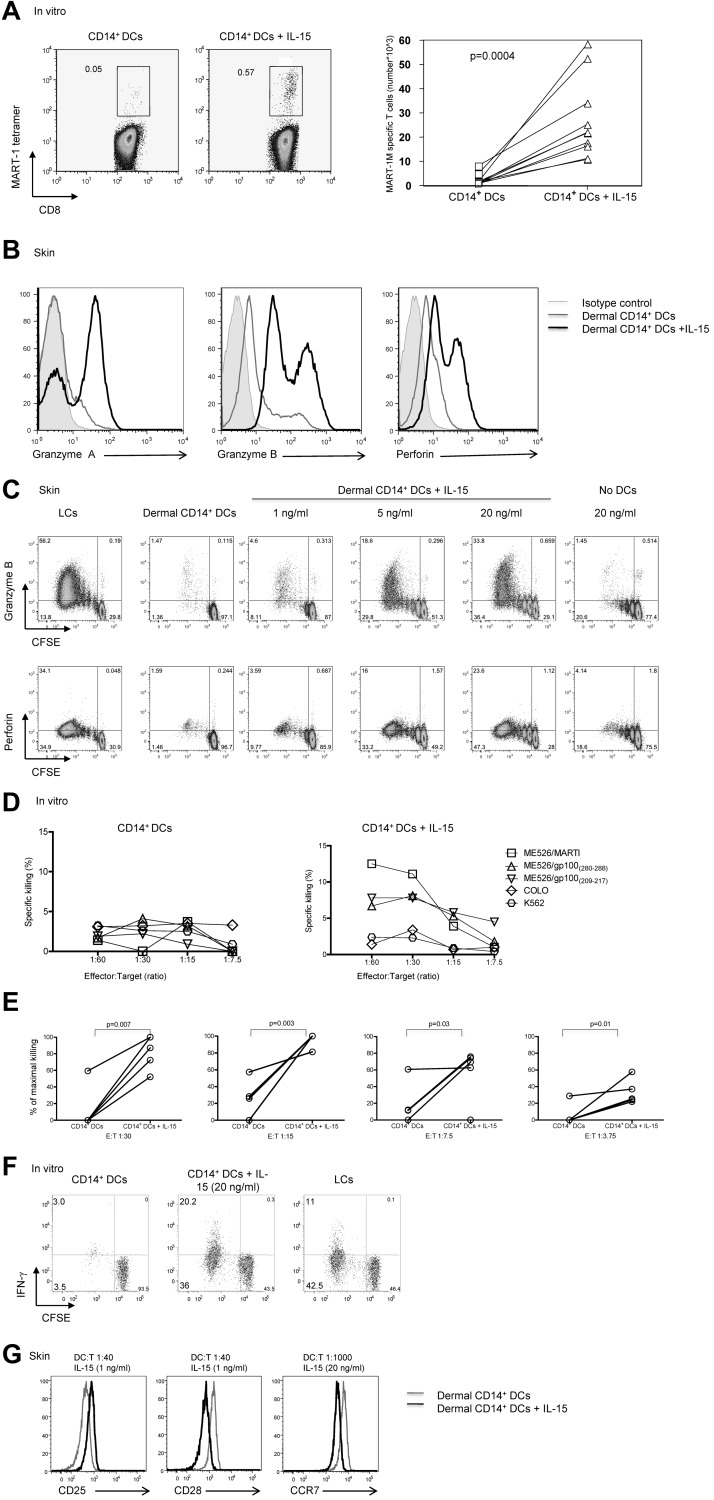
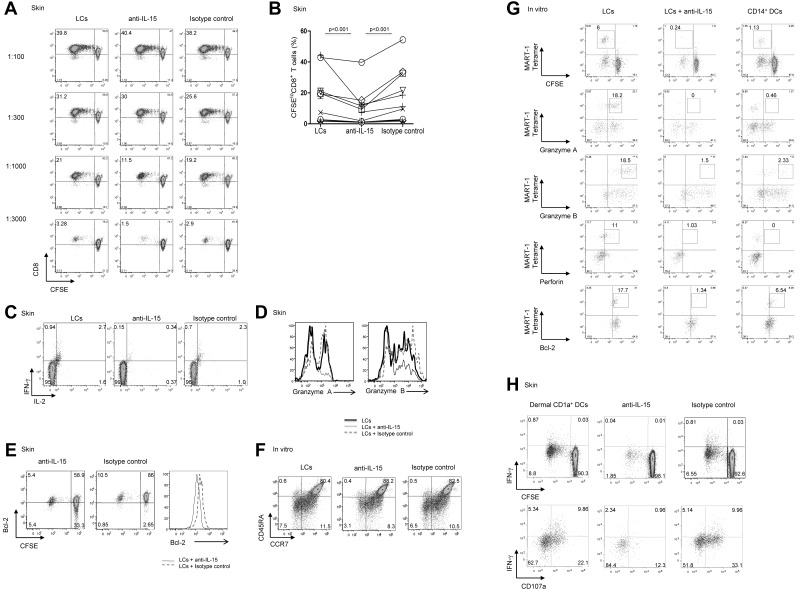
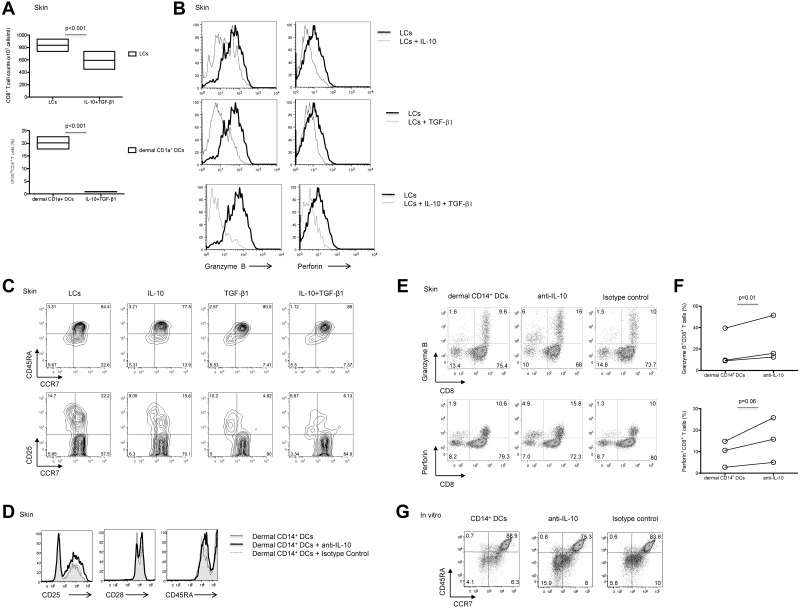
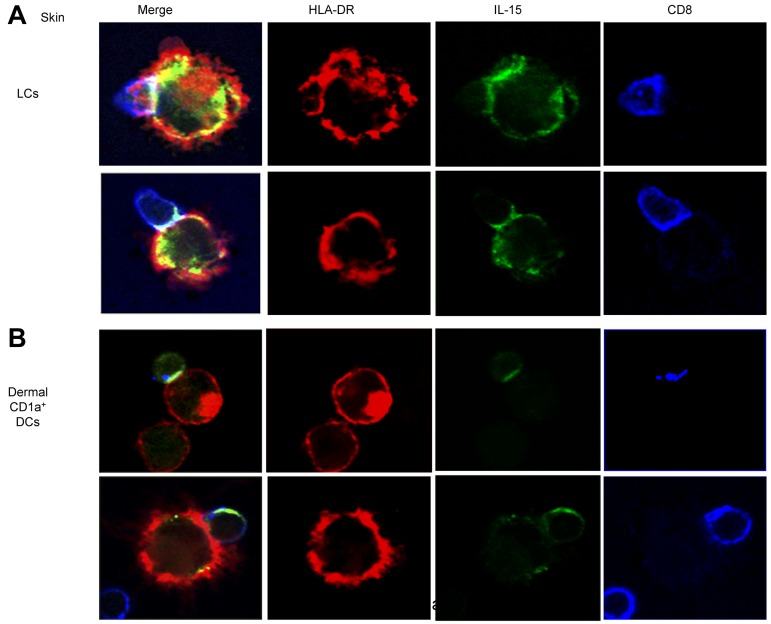
We recently reported that human epidermal Langerhans cells (LCs) are more efficient than dermal CD14(+) DCs at priming naive CD8(+) T cells into potent CTLs. We hypothesized that distinctive dendritic cell (DC) cytokine expression profiles (ie, IL-15 produced by LCs and IL-10 expressed by dermal CD14(+) DCs) might explain the observed functional difference. Blocking IL-15 during CD8(+) T-cell priming reduced T-cell proliferation by ∼ 50%. These IL-15-deprived CD8(+) T cells did not acquire the phenotype of effector memory cells. They secreted less IL-2 and IFN-γ and expressed only low amounts of CD107a, granzymes and perforin, and reduced levels of the antiapoptotic protein Bcl-2. Confocal microscopy analysis showed that IL-15 is localized at the immunologic synapse of LCs and naive CD8(+) T cells. Conversely, blocking IL-10 during cocultures of dermal CD14(+) DCs and naive CD8(+) T cells enhanced the generation of effector CTLs, whereas addition of IL-10 to cultures of LCs and naive CD8(+) T cells inhibited their induction. TGF-β1 that is transcribed by dermal CD14(+) DCs further enhanced the inhibitory effect of IL-10. Thus, the respective production of IL-15 and IL-10 explains the contrasting effects of LCs and dermal CD14(+) DCs on CD8(+) T-cell priming.


Figures

Figure 1
Figure 1
IL-15 enhances CD8+ T-cell priming. (A left) In vitro CD40L-activated HLA-A*0201+ CD14+ DCs were loaded with MART-1(26-35) peptide (3μM) and cultured with autologous naive CD8+ T cells for 9 days with or without IL-15 (20 ng/mL). CD40L and IL-7 were added on day 0, and IL-2 was added on day 3. The expansion of Ag-specific CD8+ T cells was assessed by flow cytometry with the use of MART-1(26-35)–HLA-A*0201 tetramer. Data are representative of 8 independent experiments. (A right) Graph shows the absolute MART-1(26-35)–specific cells per milliliter of 8 independent experiments. Statistical analysis was performed using paired Student t test. (B) Allogeneic naive CD8+ T cells were primed by CD40L-activated dermal CD14+ DCs with or without IL-15 for 7 days and analyzed by flow cytometry for the intracellular expression of the effector molecules: granzyme A, granzyme B, and perforin. Gray histogram shows staining with an isotype control. Data are representative of 3 independent experiments. (C) Intracellular expression of the effector molecules, granzyme B and perforin, by allogeneic CD8+ T cells primed for 7 days by CD40L-activated skin LCs or dermal CD14+ DCs without or with increasing dose of IL-15 (1, 5, and 20 ng/mL, left panel). (Right panel) Expression level granzyme B and perforin cultured for 7 days with IL-15 (20 ng/mL) and no DCs. Data are representative of 3 independent experiments. (D) The cytotoxic activity of MART-1(26-35)–specific CD8+ T cells primed by in vitro peptide–loaded autologous CD14+ DCs for 2 consecutive stimulations with or without IL-15 as assessed in a standard 51Cr release assay against an HLA-A*0201+ melanoma cell line MEL526 expressing HLA-A*0201–MART-1 complexes at indicated E:T ratios. CD40L and IL-7 were added on day 0, and IL-2 was added on day 3 of the primary coculture. Data are expressed as mean of triplicate measurements for a single donor representative of 3 independent experiments with the use of different donors. (E) The cytotoxic activity of MART-1(26-35)–specific or gp100(209-217)–specific CD8+ T cells primed by in vitro peptide–loaded autologous CD14+ DCs for 2 consecutive stimulations with or without IL-15 as assessed in a standard 51Cr release assay against target cells expressing peptide HLA-A*0201 complexes at indicated E:T ratios. CD40L and IL-7 were added on day 0, and IL-2 was added on day 3 of the primary coculture. Graph shows percentage of maximal killing of 5 experiments with the use of different target cells and different donors. (F) Allogeneic CD8+ T cells were primed for 8 days with sorted in vitro CD40L-activated DC subsets. Plots show the level of CFSE dilution and IFN-γ expression after 6 hours of re-stimulation with fresh DCs in the presence of monensin and anti-CD28/49d. Data are representative of 3 independent experiments. (G) Histogram shows CD25, CD28, and CCR7 receptor expression level by the viable CFSEloCD8+ T cells that were exposed to allogeneic CD40L-activated dermal CD14+ DCs with (black) or without (gray) soluble IL-15, at indicated DC/T-cell ratio and cytokine concentrations. Data are representative of 3 independent experiments.
Figure 2
Figure 2
Blocking DC-derived IL-15 inhibits priming of effector CD8+ T cells. (A) CD8+ T cells were labeled with CFSE and primed for 7 days with decreasing numbers of allogeneic CD40L-activated skin LCs. Neutralizing IL-15 mAb (clone MAB 647; R&D Systems) and anti–IL-15Rα (clone AF247; R&D Systems) or isotype-matched control mAbs were used as indicated. Dot plots showing the proportion of cells that diluted CFSE (CFSElo) were assessed by flow cytometry. Data are shown from 1 of 11 independent experiments. (B) Graph shows the proportions of CD8+ T cells that were primed by allogeneic CD40L-activated LCs at a DC/T-cell ratio of 1:1000 or lower, in the presence of neutralizing mAb to IL-15 or matched isotype control. Graph shows data of 11 independent experiments; P < .001. (C) Purified naive CD8+ T cells were primed for 7 days by allogeneic CD40L-activated skin LCs. Neutralizing anti–IL-15 mAb or a control mAb was added as indicated. The cultured cells were activated for 24 hours with fresh LCs. Monensin was added during the last 6 hours, and intracellular IFN-γ and IL-2 production were measured by flow cytometry. Data are representative of 3 independent experiments. (D) CFSE-labeled naive CD8+ T cells were primed for 7 days by allogeneic CD40L-activated skin LCs in the presence of neutralizing anti–IL-15 mAb or an isotype-matched control. Histograms show intracellular expression of the effector molecules granzyme A and granzyme B by the viable CD3+CD8+CFSElo T cells in response to o/n restimulation with fresh LCs as analyzed by flow cytometry. Data are representative of 3 independent experiments. (E) CD40L-activated skin LCs were used to prime allogeneic naive CFSE-labeled T cells. Neutralizing IL-15 or an isotype-matched control mAb was added to the coculture. After 7 days, the dilution of CFSE and intracellular Bcl-2 expression by the cultured CD8+ T cells were assessed by flow cytometry. Histogram shows the expression of Bcl-2 by the viable CD3+CD8+CFSElo T cells. Data are representative of 3 independent experiments. (F) CD8+ T cells were cultured with autologous peptide-loaded sorted in vitro HLA-A*0201+ LCs with a neutralizing anti–IL-15 mAb or an isotype-matched control. CD40L and IL-7 were added on day 0, and IL-2 was added on day 3. After 10 days, cells were restimulated for 24 hours with fresh DCs, and effector memory populations were analyzed by flow cytometry that was based on the costaining with CCR7 and CD45RA. Data are representative of 3 independent experiments. (G) In vitro HLA-A*0201+ DC subsets were used to prime autologous naive CD8+ T cells. CD40L and IL-7 were added on day 0, and IL-2 was added on day 3 of the primary coculture. Neutralizing mAb to IL-15 was added to the coculture of naive CD8+ T cells and in vitro LCs. Cells were analyzed after 2 consecutive stimulations by flow cytometry for the dilution of CFSE dye, frequency of MART-1 tetramer–binding cells, and intracellular expression of granzymes, perforin, and Bcl-2 proteins. Data are representative of ≥ 3 independent experiments. (H) CFSE-labeled naive CD8+ T cells were primed with allogeneic CD40L-activated dermal CD1a+ DCs at the indicated 1:40 DC/T-cell ratio and with anti–IL-15 or an isotype-matched control mAb. After 9 days, cells were harvested and restimulated for 6 hours with fresh autologous LCs in the presence of monensin and anti-CD28/CD49d to assess IFN-γ production and CD107a surface mobilization. (Bottom panel) Cells are gated on viable CD3+CD8+CFSElo T cells. Data are representative of 4 independent experiments.
Figure 3
Figure 3
Dermal CD14+ DC-derived IL-10 and TGF-β1 prevent the generation of effector CTLs. (A) CFSE-labeled naive CD8+ T cells were stimulated with allogeneic CD40L-activated skin LCs (top panel) or dermal CD1a+ DCs (bottom panel) in the presence of IL-10 (10 ng/mL) and TGF-β1 (5 ng/mL). Graph shows the absolute CD8+ T-cell number or the proportion of CD8+ T cells that diluted CFSE dye (CFSElo) as measured after 7 days by flow cytometry. Boxes represent average results of 4 independent experiments; P < .001. (B) Flow cytometric analysis of granzyme B and perforin expression by the CD8+CFSElo T cells cultured for 7 days over allogeneic CD40L-activated skin LCs with (gray histogram) or without (black histogram) IL-10 and/or TGF-β1 as indicated. Results are representative of 3 independent experiments. (C) Flow cytometric analysis of CD8+ T-cell subsets (as indicated by the expression of CCR7 and CD45RA; top panel) and the activation marker CD25 (bottom panel) by CD8+ T cells cultured for 7 days over allogeneic CD40L-activated skin LCs conditioned with IL-10, TGF-β1, or a combination of the 2 cytokines. Data are representative of 3 independent experiments. (D) Flow cytometric analysis of surface receptors (CD25, CD28, and CD45RA) expression by CFSEloCD8+ T cells cultured for 6 days with allogeneic CD40L-activated dermal CD14+ DCs with a neutralizing IL-10 mAb or an isotype-matched control after reactivation with fresh autologous DCs for 24 hours before the analysis. Data are representative of 3 independent experiments. (E) Similar experiment as in panel D. Dot plots show the expression of granzyme B (top panel) and perforin (bottom panel) by the cultured viable CD3+CD8+ T cells. Data are representative of 3 independent experiments. (F) Granzyme B (top panel) and perforin (bottom panel) expression as measured by the cultured viable CD3+CD8+ T cells in 3 independent experiments; P = .01 and P = .06, respectively. (G) CD8+ T cells were cultured with autologous peptide-loaded in vitro HLA-A*0201+ CD14+ DCs in the presence of neutralizing anti–IL-10 mAb or an isotype-matched control for 10 days. CD40L and IL-7 were added on day 0, and IL-2 was added on day 3. Cells were restimulated for 24 hours with fresh DCs, and effector memory populations were analyzed by flow cytometry that was based on the costaining with CCR7 and CD45RA. Data are representative of 3 independent experiments.
Figure 4
Figure 4
IL-15 concentrates in the DC–T-cell immunologic synapse. Skin LCs (top panel) or dermal CD1a+ DCs (bottom panel) were cocultured with purified allogeneic naive CD8+ T cells for 12 hours. CD40L was used to activate the DCs. Confocal immunofluorescence images show IL-15 accumulation (green) at the immunologic synapse that is generated between skin LCs (top panel) or dermal CD1a+ DCs (bottom panel) and naive CD8+ T cells. HLA-DR and CD8 are represented in red and blue, respectively. Data are representative of 3 independent experiments.

References

    1. Klebanoff CA, Gattinoni L, Restifo NP. CD8+ T-cell memory in tumor immunology and immunotherapy. Immunol Rev. 2006;211:214–224. - PMC - PubMed
    1. Blattman JN, Greenberg PD. Cancer immunotherapy: a treatment for the masses. Science. 2004;305(5681):200–205. - PubMed
    1. Seder RA, Darrah PA, Roederer M. T-cell quality in memory and protection: implications for vaccine design. Nat Rev Immunol. 2008;8(4):247–258. - PubMed
    1. Pulendran B, Ahmed R. Translating innate immunity into immunological memory: implications for vaccine development. Cell. 2006;124(4):849–863. - PubMed
    1. Palucka K, Banchereau J, Mellman I. Designing vaccines based on biology of human dendritic cell subsets. Immunity. 2010;33(4):464–478. - PMC - PubMed

Publication types

MeSH terms