. 2012 Jul 1;303(1):F120-9.
doi: 10.1152/ajprenal.00110.2012. Epub 2012 Apr 25.

Fight-or-flight: murine unilateral ureteral obstruction causes extensive proximal tubular degeneration, collecting duct dilatation, and minimal fibrosis

Affiliations

Fight-or-flight: murine unilateral ureteral obstruction causes extensive proximal tubular degeneration, collecting duct dilatation, and minimal fibrosis

Michael S Forbes et al. Am J Physiol Renal Physiol. .

Abstract

Unilateral ureteral obstruction (UUO) is the most widely used animal model of progressive renal disease. Although renal interstitial fibrosis is commonly used as an end point, recent studies reveal that obstructive injury to the glomerulotubular junction leads to the formation of atubular glomeruli. To quantitate the effects of UUO on the remainder of the nephron, renal tubular and interstitial responses were characterized in mice 7 and 14 days after UUO or sham operation under anesthesia. Fractional proximal tubular mass, cell proliferation, and cell death were measured by morphometry. Superoxide formation was identified by nitro blue tetrazolium, and oxidant injury was localized by 4-hydroxynonenol and 8-hydroxydeoxyguanosine. Fractional areas of renal vasculature, interstitial collagen, α-smooth muscle actin, and fibronectin were also measured. After 14 days of UUO, the obstructed kidney loses 19% of parenchymal mass, with a 65% reduction in proximal tubular mass. Superoxide formation is localized to proximal tubules, which undergo oxidant injury, apoptosis, necrosis, and autophagy, with widespread mitochondrial loss, resulting in tubular collapse. In contrast, mitosis and apoptosis increase in dilated collecting ducts, which remain patent through epithelial cell remodeling. Relative vascular volume fraction does not change, and interstitial matrix components do not exceed 15% of total volume fraction of the obstructed kidney. These unique proximal and distal nephron cellular responses reflect differential "fight-or-flight" responses to obstructive injury and provide earlier indexes of renal injury than do interstitial compartment responses. Therapies to prevent or retard progression of renal disease should include targeting proximal tubule injury as well as interstitial fibrosis.


Figures
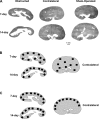
Fig. 1.
Fig. 1.
A: representative sagittal sections of kidneys from mice subjected to unilateral ureteral obstruction (UUO) or sham operation. Progressive loss of kidney mass occurs through parenchymal thinning of obstructed kidney. Solid lines superimposed on 14-day UUO kidney profile demonstrate procedure whereby average parenchymal thicknesses were established, with dotted line demarcating papilla. B: positioning of 10 microscopic fields for stereological assessment of parameters including mitosis, apoptosis, α-smooth muscle actin (α-SMA), and fibronectin. (The same sampling approach is utilized for contralateral and sham-operated kidneys.) C: sampling pattern utilized for measurement of proximal tubule contribution (also see Fig. 3).
Fig. 2.
Fig. 2.
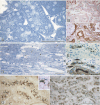
Proximal tubular damage resulting from ureteral obstruction. A: sham-operated kidney. Semithin plastic section of a cortical field consists largely of proximal tubules, which are composed of columnar epithelial cells containing numerous rod-shaped mitochondria. Structurally similar cells make up the capsule of an adjacent glomerulus (G). B: contralateral kidney from 14-day UUO mouse perfused with nitro blue tetrazolium (NBT) to demonstrate sites of superoxide production in the form of blue diformazan crystals (arrowheads) concentrated at basal surfaces of proximal tubules (PT) and glomerular capsules (G). Note lack of labeling of cortical collecting duct (CCD). C: NBT-perfused, sham-operated kidney. Field is similar to B but stained with Lotus tetragonolobus lectin to confirm identity of diformazan-decorated profiles as belonging to proximal tubules and similar epithelial cells of the capsule of the glomerulus (G). D–H: obstructed kidney from 14-day UUO mice. D: semithin plastic section through the remaining cortex showing fragmented segments of collapsed proximal tubules. Arrows, apoptotic figures; ∗, autophagic bodies. E and F: serial consecutive sections subjected to terminal deoxynucleotidyl transferase-mediated dUTP-biotin nick-end labeling (TUNEL) procedure (E) and Lotus lectin staining (F). Two proximal tubule profiles, one collapsed and the other relatively normal, show strong lectin positivity; only degenerating tubule shows evidence of apoptosis (arrows). G: 4-hydroxynonenal immunostaining of a collapsed proximal tubule from a kidney perfused with NBT. Nuclei (Nu) are unstained. Note dense cytoplasmic immunostaining (denoting oxidant injury), along with blue diformazan crystals, which result from interaction of NBT with sites of superoxide activity. Inset: detail of diaminobenzidine chromogen (brown) and diformazan (blue). Micrograph was deliberately intensified by selection of the blue channel to distinguish between the 2 forms of precipitate. H: similar to G, but with 8-hydroxy-2′-deoxyguanosine immunostaining, which demonstrates oxidative damage to nuclei. Note opacified nuclei and abundant diformazan crystals, as well as a darkly stained apoptotic figure (arrow), within epithelial cells of fragmented proximal tubular segment. Scale bars, 50 μm (bar in C applies to B and C, bar in F applies to E and F, and bar in H applies to G and H). Magnification of inset in G is doubled.
Fig. 3.
Fig. 3.
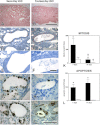
Microscopic and morphometric evaluations of contributions of proximal tubule complement in sham-operated vs. obstructed and contralateral kidneys at 7 and 14 days after operation. A: Lotus lectin staining clearly delineates proximal tubules. B: 2 images of the same cortical field as they appear with image analysis software before (top) and after (bottom) digital contrasting of proximal tubules (shown in red) to measure their volume fraction within the field. C: proximal tubule contribution. Solid bars, obstructed kidney; open bars, sham and contralateral kidney. Values are means ± SE. *P < 0.05 vs. contralateral kidney. Considerable loss of proximal tubular mass has occurred by 7 days; by 14 days, many of the proximal tubular remnants have collapsed (also see Fig. 2). Contralateral kidneys' proximal tubules retain normal-appearing morphology at both stages, and there is no change in proximal tubular fraction in contralateral compared with sham-operated kidneys. Scale bar, 100 μm.
Fig. 4.
Fig. 4.
Temporal effects of UUO on collecting ducts in obstructed kidneys. A, C, E, G, and I: 7-day kidney. B, D, F, H, and J: 14-day kidney. A and B: survey views of median sagittal sections stained with picrosirius red. Dilated collecting ducts are evident after 7 days of obstruction, but their incidence decreases by 14 days as parenchyma becomes thinner. C–F: “semithin” (0.25-μm) plastic sections of glutaraldehyde-perfused obstructed kidneys. In C and D, red-rimmed dots are centered over epithelial cell nuclei (higher-magnification details of tubule walls are shown in E and F, respectively), illustrating attenuated cell profiles with widely separated nuclei at 7 days of UUO (C and E), in contrast to reduction in tubule dilatation and crowding of uniformly cuboidal epithelial cells after 14 days of UUO (D and F). G and H: phosphorylated histone-stained sections showing extensive mitotic activity in collecting ducts after 7 days (G) but a sharp decline by 14 days (H). I and J: TUNEL staining for apoptosis, which is found routinely in collecting ducts at 7 and 14 days of obstruction. Scale bars: 100 μm (B, applies to A and B); 50 μm (D, applies to C and D); 10 μm (F, applies to E and F); 50 μm (J, applies to G–J). K and L: morphometric measurements of mitosis and apoptosis, respectively. Solid bars, obstructed kidney; open bars, sham and contralateral kidney. Values are means ± SE. *P < 0.05 vs. contralateral kidney. *P < 0.05 vs. obstructed kidney. †P < 0.05 vs. 7 days.
Fig. 5.
Fig. 5.
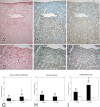
Effects of UUO on interstitium of obstructed kidney. A–F: distribution of collagen (A and D), α-SMA (B and E), and fibronectin (C and F) staining in serial consecutive sections of kidneys following 14 days of UUO. In obstructed kidney of adult mouse, aside from the capsule, only scattered concentrations of collagen fibrils, identifiable by picrosirius red staining, are seen (A, examples at arrows in D), whereas α-SMA staining (B and E, brown coloration) is more generally distributed and cell-based, with fibronectin appearing throughout the interstitium (C and F). Scale bar: 100 μm (C, applies to A–C; F, applies to D–F). G–I: renal interstitial responses to UUO. G: collagen (picrosirius red staining). H: α-SMA. I: fibronectin. Solid bars, obstructed kidney; open bars, contralateral kidney. Values are means ± SE. *P < 0.05 vs. contralateral kidney. †P < 0.05 vs. 7 days.
Fig. 6.
Fig. 6.
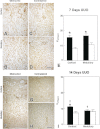
Renal microvascular distribution in adult kidneys after 7 days (A–E) and 14 days (F–I) of UUO. After 14 days, platelet-endothelial cell adhesion molecule (PECAM) staining is more intense in obstructed (F) than contralateral (G and H) kidney. Stereological evaluation (E and I) shows vascular volume fraction [Vv(Vasc)] values that are greater in cortex and medulla of obstructed (solid bars) than contralateral (open bars) kidney after 7 days and in cortex after 14 days (I). Scale bars, 100 μm (D, applies to A–D; H, applies to F–H). *P < 0.05 vs. contralateral kidney. †P < 0.05 vs. 7 days.
Fig. 7.
Fig. 7.
Effects of 14 days of UUO on fractional distribution of renal parenchymal compartments. Parenchymal mass is estimated by kidney weight: note 18% loss of parenchyma by obstructed compared with sham-operated kidney. Fractional contributions to parenchyma of obstructed kidney have been reduced in proportion to 18% decrease in kidney weight compared with sham-operated kidney. The most dramatic effect of UUO is reduction of proximal tubular mass, which decreases from 65% to 23% after 14 days of obstruction. Fractional contribution of collagen increases from <1% to 3% in obstructed kidney, while fractional contribution of fibronectin increases from 2% to 11% and that of α-smooth muscle actin increases from <1% to 3%. Fractional vascular contribution changes little, from 8% to 9%, and remaining parenchyma (including dilated distal nephrons) increases from 24% to 32%.

References

    1. Bascands JL, Schanstra JP. Obstructive nephropathy: insights from genetically engineered animals. Kidney Int 68: 925–937, 2005 - PMC - PubMed
    1. Buhrle CP, Hackenthal E, Helcher U, Lackner K, Nobiling R, Steinhausen M, Taugner R. Methods in laboratory investigation. The hydronephrotic kidney of the mouse as a tool for the intravital microscopy and in vitro electrophysiological studies of renin-containing cells. Lab Invest 54: 462–482, 1986 - PubMed
    1. Cachat F, Lange-Sperandio B, Chang AY, Kiley SC, Thornhill BA, Forbes MS, Chevalier RL. Ureteral obstruction in neonatal mice elicits segment-specific tubular cell responses leading to nephron loss. Kidney Int 63: 564–575, 2003 - PubMed
    1. Chevalier RL. Chronic partial ureteral obstruction in the neonatal guinea pig. II. Pressure gradients affecting glomerular filtration rate. Pediatr Res 18: 1271–1277, 1984 - PubMed
    1. Chevalier RL, Forbes MS, Thornhill BA. Ureteral obstruction as a model of renal interstitial fibrosis and obstructive nephropathy. Kidney Int 75: 1145–1152, 2009 - PubMed

Publication types

LinkOut - more resources