

Aggregation in woodlice: social interaction and density effects
- PMID: 22536104
- PMCID: PMC3335410
- DOI: 10.3897/zookeys.176.2258
Aggregation in woodlice: social interaction and density effects
Abstract
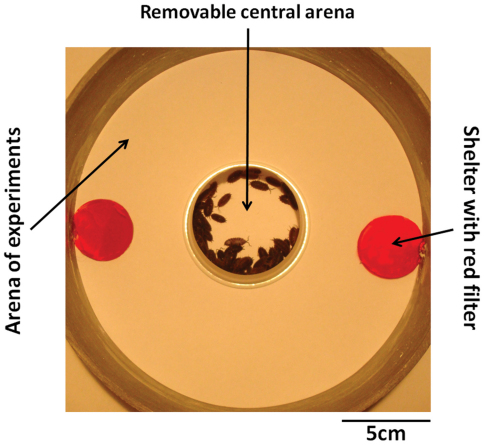
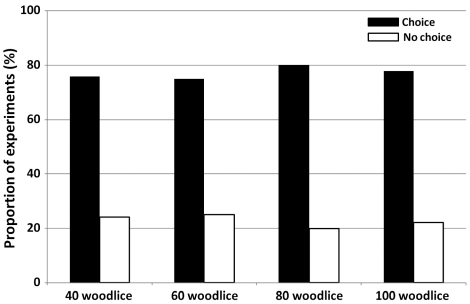
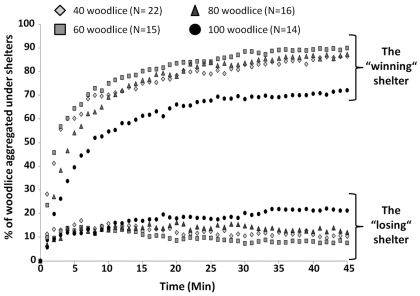
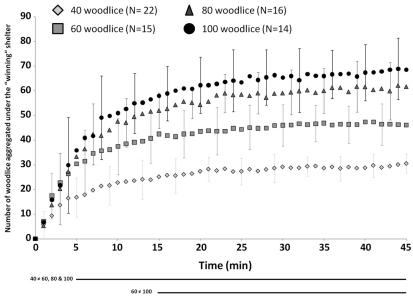
Terrestrial isopods are known to be sensitive to humidity, brightness or temperature. Until now, aggregation was assumed to depend on these sensitivities as a result of individual preferences. In this paper, we show that the social component is also important in the isopod aggregation phenomenon. In experimental arenas with two identical shelters up to nearly 90% of woodlice aggregated under shelters. This aggregation was quick as in 10 minutes most of the animals aggregated, irrespective of their density. Nonetheless, 10-15% of the animals walked around the arena, rarely forming very small and short-lasting aggregates outside shelters. Woodlice aggregated preferably under one of the shelters in 77% of experiments. Indeed, almost 80% of the animals out of 40, 60 or 80 animals in the arena aggregated under one shelter. In arenas with 100 individuals the aggregations were proportionally smaller (70%). Our results revealed that 70 animals was a maximum number of woodlice in an aggregate. We concluded that the location of aggregates is strongly governed by individual preferences but the dynamics of aggregation and collective choice are controlled by social interaction between congeners. The tested densities of the animals in the arena did not impact the aggregation patterns.
Keywords: Woodlouse; aggregation; density; dynamics; social interaction.
Figures
References
-
- Allee WC. (1926) Studies in animal aggregations: Causes and effects of bunching in land isopods. Journal of Experimental Zoology 45 (1): 255-277.
-
- Allee WC. (1931) Animal aggregations, a study in general sociology. The University of Chicago Press, Chicago Illinois, 431 pp.
-
- Brereton JLG. (1956) A study of some factors controlling the population of some terrestrial. Ph.D. Thesis: Oxford University.
-
- Brockett B, Hassall M. (2005) The existence of an Allee effect in populations of Porcellio scaber (Isopoda: Oniscidea). European Journal of Soil Biology 41: 123-127.
-
- Camazine S, Deneubourg J-L, Franks NR, Sneyd J, Theraulaz G, Bonabeau E. (2001) Self-organization in biological systems. Princeton University Press, Princeton, 560 pp.
LinkOut - more resources
Full Text Sources