. 2012 Apr 24:6:13.
doi: 10.3389/fninf.2012.00013. eCollection 2012.

The importance of combining MRI and large-scale digital histology in neuroimaging studies of brain connectivity and disease

Affiliations

The importance of combining MRI and large-scale digital histology in neuroimaging studies of brain connectivity and disease

Jacopo Annese. Front Neuroinform. .

Abstract

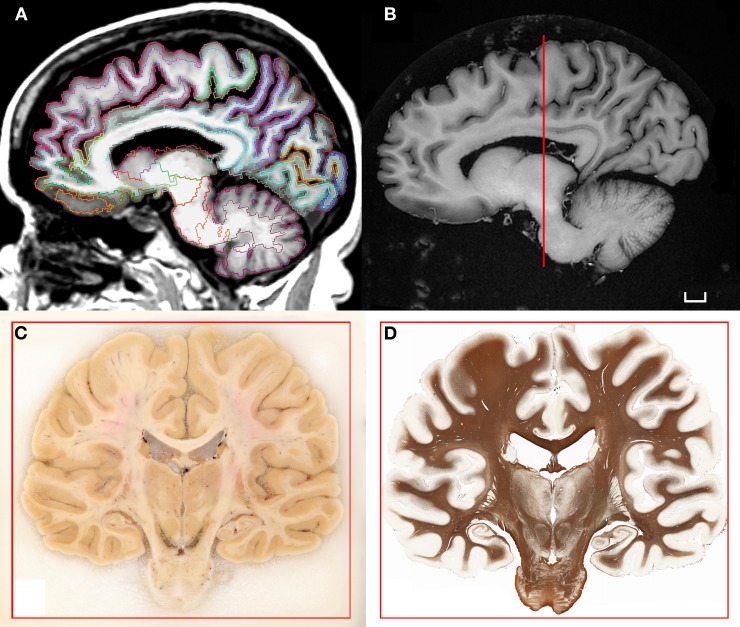
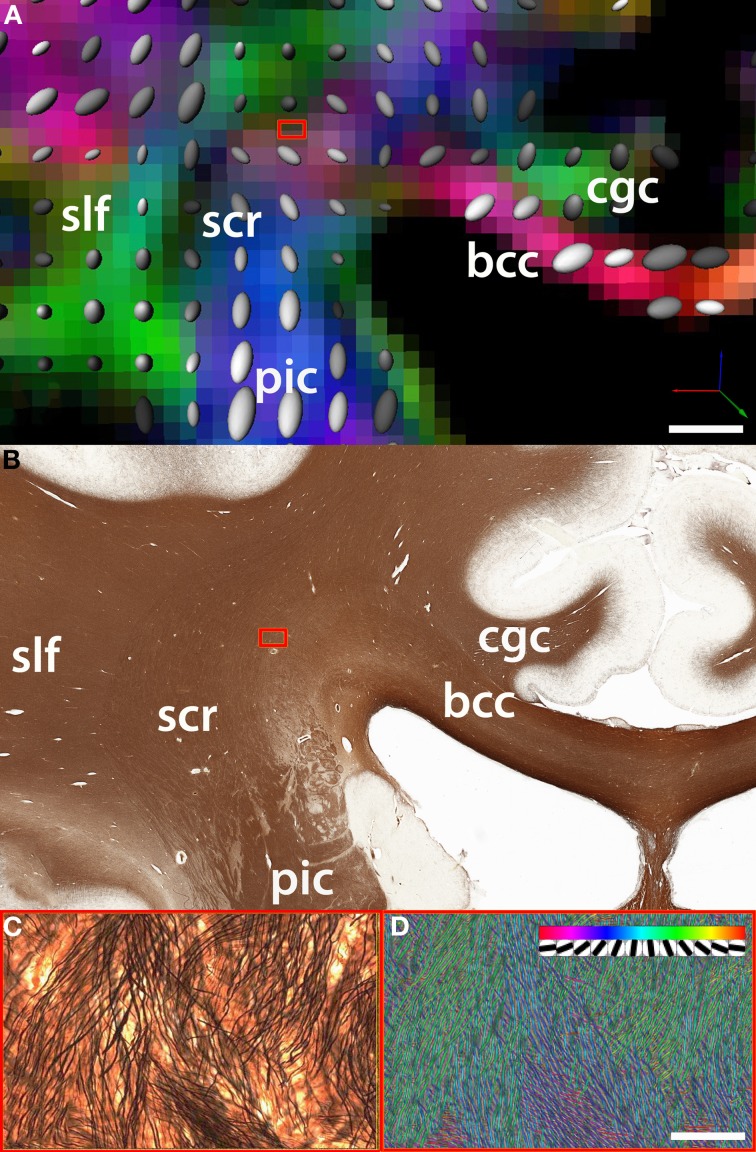
One of the major issues hindering a comprehensive connectivity model for the human brain is the difficulty in linking Magnetic Resonance Imaging (MRI) measurements to anatomical evidence produced by histological methods. In vivo and postmortem neuroimaging methodologies are still largely incompatible in terms of sample size, scale, and resolution. To help bridge the hiatus between different approaches we have established a program that characterizes the brain of individual subjects, combining MRI with postmortem neuroanatomy. The direct correlation of MRI and histological features is possible, because registered images from different modalities represent the same regions in the same brain. Comparisons are also facilitated by large-scale, digital microscopy techniques that afford images of the whole-brain sections at cellular resolution. The goal is to create a neuroimaging catalog representative of discrete age groups and specific neurological conditions. Individually, the datasets allow for investigating the relationship between different modalities; combined, they provide sufficient predictive power to inform analyzes and interpretations made in the context of non-invasive studies of brain connectivity and disease.

Keywords: DTI; MRI; brain; connectivity; fibers; histology; human; pathology.


Figures

Figure 1
Figure 1
(A) T1-weighted scan of the brain of H.T. acquired in situ 3D IR-SPGR, matrix size: 256 × 256, voxel size of 0.9375 × 0.9375, slice thickness = 1.2 mm. The volume underwent the automated labeling of subcortical structures and cortical gyri that is part of the morphometry pipeline included in the software Freesurfer (Fischl et al., 2002, 2004). (B) High-resolution T1-weighted scan of the formalin-fixed specimen imaged ex situ. The brain was scanned in a dedicated chamber filled with phosphate buffer (matrix size: 512 × 512, pixel size: 0.5/0.5, slice thickness: 1.2 mm). Multiple acquisitions were repeated in order to increase the signal-to-noise ratio. (C) Coronal blockface image from the same brain at the level of the posterior hippocampus. (D) Corresponding histological slice stained for myelinated fibers [protocol modified from Gallyas (1979); Annese et al. (2004)]. Scale bar: 1 cm.
Figure 2
Figure 2
Comparison between (A) fiber orientation maps derived from DTI and (B) the underlying myelo-architecture in the region of intersection of the fibers belonging to the corpus callosum (cc) which travel along the coronal plane (parallel to the plane of the figure) and the superior corona radiata (scr). In this example, the region of intersection between cc fibers and the scr is an area that shows significant crossing over of fibers of small caliber (blue box). (C) One DTI voxel-wide selection from silver-stained tissue slice (magnification = 20×). (D) The density and orientation of single white matter fibers is quantified using a template matching algorithm [Bartsch et al. (2011)]. The insert in panel D shows the discrete orientations of the templates used to classify fiber bundles. DTI acquisition parameters: image matrix size = 96 × 96, B0 = 1000, 51 directions, FOV = 24 cm, 47 axial slices, slice thickness = 2.5 mm. Fiber track definition derived from the atlas of Oishi and colleagues (2011); bcc: body of the corpus callosum; cgc: cingulum; slf: superior longitudinal fasciculus. Scale bars: Panel B = 5 mm; Panel C = 100 microns.

References

    1. Akil H., Martone M. E., van Essen D. C. (2011). Challenges and opportunities in mining neuroscience data. Science 331, 708–712 10.1126/science.1199305 - DOI - PMC - PubMed
    1. Annese J. (2010). “Deconstructing Henry. The Neuroanatomy and Neuroinformatics of the Brain of the Amnesic Patient H.M. Program No. 397.18,” Neuroscience Meeting Planner. 40th Annual Meeting of the Society for Neuroscience. (San Diego, CA). [Online].
    1. Annese J., Schenker M. N., Ha C., Maechler P., Sheh C., Bartsch H. (2012). A public atlas of the human brain. Web-resource. http://thebrainobservatory.ucsd.edu/content/public-brain-atlas
    1. Annese J., Pitiot A., Toga A. W. (2004). A myelo-architectonic method for the structural classification of cortical areas. Neuroimage 21, 15–26 10.1016/j.neuroimage.2003.08.024 - DOI - PubMed
    1. Annese J., Schenker M. N., Candido C. (2009). “Anatomical mapping and digital pathology of the human brain by Giant Whole Slide Imaging (GWSI),” Program No. 104.5. Neuroscience Meeting Planner. 39th Annual Meeting of the Society for Neuroscience. (Chicago, IL). [Online].

LinkOut - more resources